Reebok 2008 Annual Report Download - page 92
Download and view the complete annual report
Please find page 92 of the 2008 Reebok annual report below. You can navigate through the pages in the report by either clicking on the pages listed below, or by using the keyword search tool below to find specific information within the annual report.-
 1
1 -
2
-
3
-
4
-
5
-
6
-
7
-
8
-
9
-
10
-
11
-
12
-
13
-
14
-
15
-
16
-
17
-
18
-
19
-
20
-
21
-
22
-
23
-
24
-
25
-
26
-
27
-
28
-
29
-
30
-
31
-
32
-
33
-
34
-
35
-
36
-
37
-
38
-
39
-
40
-
41
-
42
-
43
-
44
-
45
-
46
-
47
-
48
-
49
-
50
-
51
-
52
-
53
-
54
-
55
-
56
-
57
-
58
-
59
-
60
-
61
-
62
-
63
-
64
-
65
-
66
-
67
-
68
-
69
-
70
-
71
-
72
-
73
-
74
-
75
-
76
-
77
-
78
-
79
-
80
-
81
-
 82
82 -
 83
83 -
 84
84 -
 85
85 -
 86
86 -
 87
87 -
 88
88 -
 89
89 -
 90
90 -
 91
91 -
 92
92 -
 93
93 -
 94
94 -
 95
95 -
 96
96 -
 97
97 -
 98
98 -
 99
99 -
 100
100 -
 101
101 -
 102
102 -
103
-
104
-
105
-
106
-
107
-
108
-
109
-
110
-
111
-
112
-
113
-
114
-
115
-
116
-
117
-
118
-
119
-
120
-
121
-
122
-
123
-
124
-
125
-
126
-
127
-
128
-
129
-
130
-
131
-
132
-
133
-
134
-
135
-
136
-
137
-
138
-
139
-
140
-
141
-
142
-
143
-
144
-
145
-
146
-
147
-
148
-
149
-
150
-
151
-
152
-
153
-
154
-
155
-
156
-
157
-
158
-
159
-
160
-
161
-
162
-
163
-
164
-
165
-
166
-
167
-
168
-
169
-
170
-
171
-
172
-
173
-
174
-
175
-
176
-
177
-
178
-
179
-
180
-
181
-
182
-
183
-
184
-
185
-
186
-
187
-
188
-
189
-
190
-
191
-
192
-
193
-
194
-
195
-
196
-
197
-
198
-
199
-
200
-
201
-
202
-
203
-
204
-
205
-
206
-
207
-
208
-
209
-
210
-
211
-
212
-
213
-
214
-
215
-
216
-
217
-
218
-
219
-
220
 |
 |
088 Group Management Report – Our Financial Year Group Business Performance — Income Statement
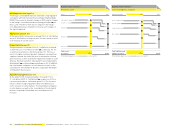
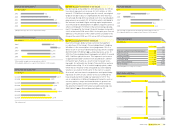
Net fi nancial expenses
€ in millions
2004 1) 2) 59
2005 2) 52
2006 3) 158
2007 134
2008 166
1) Adjusted to refl ect the application of IAS 32.
2) Figures refl ect continuing operations as a result of the divestiture of the Salomon
business segment.
3) Including Reebok business segment from February 1, 2006 onwards. Including
Greg Norman apparel business from February 1, 2006 to November 30, 2006.
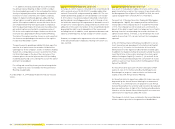
Income before taxes
€ in millions
2004 1) 2) 526
2005 2) 655
2006 3) 723
2007 815
2008 904
1) Adjusted to refl ect the application of IAS 32.
2) Figures refl ect continuing operations as a result of the divestiture of the Salomon
business segment.
3) Including Reebok business segment from February 1, 2006 onwards. Including
Greg Norman apparel business from February 1, 2006 to November 30, 2006.
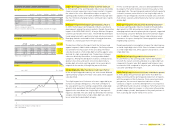
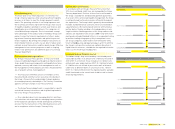
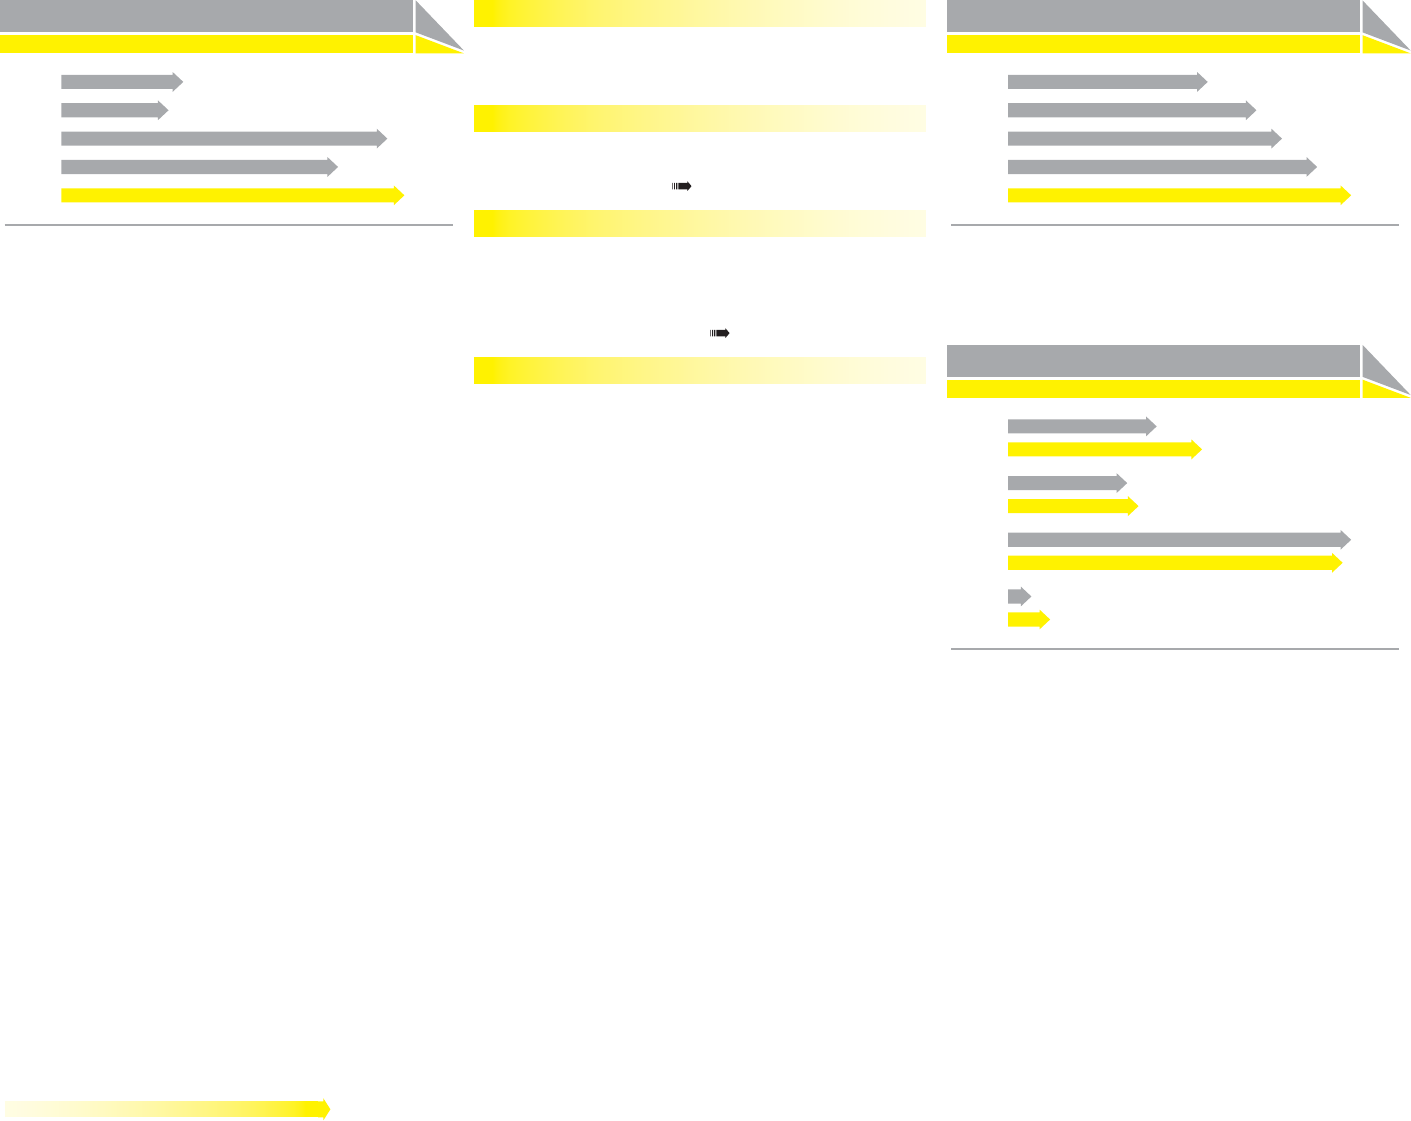
Income before taxes by quarter
€ in millions
Q1 2007
Q1 2008
191
250
Q2 2007
Q2 2008
153
169
Q3 2007
Q3 2008
441
431
Q4 2007
Q4 2008
30
54
Net fi nancial expenses increase 23%
Net fi nancial expenses increased 23% to € 166 million in 2008
from € 134 million in the prior year. This was mainly a result of
higher fi nancial expenses compared to the prior year.
Financial income up 5%
Financial income increased 5% to € 37 million in 2008 from
€ 36 million in the prior year as a result of higher interest
income from cash deposits see Note 27, p. 188.
Financial expenses increase 19%
Financial expenses increased 19% to € 203 million in 2008
(2007: € 170 million). This development was primarily due
to net foreign currency exchange losses resulting from the
revaluation of balance sheet positions in foreign currencies
other than functional currencies see Note 27, p. 188.
Income before taxes increases 11%
Income before taxes (IBT) as a percentage of sales increased
0.5 percentage points to 8.4% in 2008 from 7.9% in 2007. This
was a result of the Group’s operating margin increase, which
more than offset the increase in net fi nancial expenses. IBT for
the adidas Group increased 11% to € 904 million in 2008 from
€ 815 million in 2007.