Reebok 2008 Annual Report Download - page 108
Download and view the complete annual report
Please find page 108 of the 2008 Reebok annual report below. You can navigate through the pages in the report by either clicking on the pages listed below, or by using the keyword search tool below to find specific information within the annual report.-
 1
1 -
2
-
3
-
4
-
5
-
6
-
7
-
8
-
9
-
10
-
11
-
12
-
13
-
14
-
15
-
16
-
17
-
18
-
19
-
20
-
21
-
22
-
23
-
24
-
25
-
26
-
27
-
28
-
29
-
30
-
31
-
32
-
33
-
34
-
35
-
36
-
37
-
38
-
39
-
40
-
41
-
42
-
43
-
44
-
45
-
46
-
47
-
48
-
49
-
50
-
51
-
52
-
53
-
54
-
55
-
56
-
57
-
58
-
59
-
60
-
61
-
62
-
63
-
64
-
65
-
66
-
67
-
68
-
69
-
70
-
71
-
72
-
73
-
74
-
75
-
76
-
77
-
78
-
79
-
80
-
81
-
82
-
83
-
84
-
85
-
86
-
87
-
88
-
89
-
90
-
91
-
92
-
93
-
94
-
95
-
96
-
97
-
 98
98 -
 99
99 -
 100
100 -
 101
101 -
 102
102 -
 103
103 -
 104
104 -
 105
105 -
 106
106 -
 107
107 -
 108
108 -
 109
109 -
 110
110 -
 111
111 -
 112
112 -
 113
113 -
 114
114 -
 115
115 -
 116
116 -
 117
117 -
 118
118 -
119
-
120
-
121
-
122
-
123
-
124
-
125
-
126
-
127
-
128
-
129
-
130
-
131
-
132
-
133
-
134
-
135
-
136
-
137
-
138
-
139
-
140
-
141
-
142
-
143
-
144
-
145
-
146
-
147
-
148
-
149
-
150
-
151
-
152
-
153
-
154
-
155
-
156
-
157
-
158
-
159
-
160
-
161
-
162
-
163
-
164
-
165
-
166
-
167
-
168
-
169
-
170
-
171
-
172
-
173
-
174
-
175
-
176
-
177
-
178
-
179
-
180
-
181
-
182
-
183
-
184
-
185
-
186
-
187
-
188
-
189
-
190
-
191
-
192
-
193
-
194
-
195
-
196
-
197
-
198
-
199
-
200
-
201
-
202
-
203
-
204
-
205
-
206
-
207
-
208
-
209
-
210
-
211
-
212
-
213
-
214
-
215
-
216
-
217
-
218
-
219
-
220
 |
 |

104 Group Management Report – Our Financial Year Business Performance by Segment — Reebok Business Performance — TaylorMade-adidas Golf Business Performance
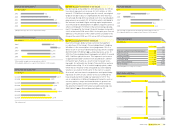
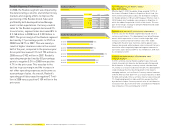
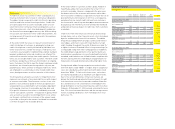
Reebok own-retail stores
2008 2007
Total 647 524
Concession Corners 67
Factory Outlets 327
Concept Stores 253
73
287
164
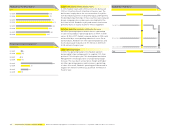
Reebok gross margin by quarter
in %
Q1 2007
Q1 2008
36.8
37.1
Q2 2007
Q2 2008
39.1
41.2
Q3 2007
Q3 2008
40.2
36.4
Q4 2007
Q4 2008
38.1
34.1
Reebok operating profi t by quarter
€ in millions
Q1 2007
Q1 2008
6
(13)
Q2 2007
Q2 2008
(1)
(11)
Q3 2007
Q3 2008
84
25
Q4 2007
Q4 2008
21
(9)
Royalty and commission income decreases
In 2008, Reebok royalty and commission income decreased
29% to € 30 million from € 42 million in the prior year. The
decline was largely due to the non-recurrence of royalties
from distribution partners in Brazil /Paraguay and
Argentina.
The distribution partnerships in these countries were replaced
by own companies whose sales were consolidated for the
fi rst time in 2008. Reebok’s royalty and commission income
primarily relates to royalty income for fi tness equipment.
Net other operating expenses and income increase
Net other operating expenses and income as a percentage
of sales increased by 2.9 percentage points to 38.7% in 2008
versus 35.8% in 2007. Reebok’s revenue decline in 2008 could
not be offset by a corresponding reduction in costs. On an
a bsolute basis, Reebok’s net other operating expenses and
income decreased modestly to € 831 million in 2008 from
€ 835 million in the prior year.
Lower operating margin
In 2008, the operating margin of the Reebok segment
decreased by 5.0 percentage points to negative 0.3% from
positive 4.7% in the prior year. This development was below
Management’s initial expectation of an operating margin
increase. This was due to a lower gross margin and higher
net other operating expenses and income as a percentage
of sales. As a result, Reebok’s operating profi t decreased to
negative € 7 million in 2008 versus positive € 109 million in
the prior year.