Reebok 2008 Annual Report Download - page 65
Download and view the complete annual report
Please find page 65 of the 2008 Reebok annual report below. You can navigate through the pages in the report by either clicking on the pages listed below, or by using the keyword search tool below to find specific information within the annual report.-
 1
1 -
2
-
3
-
4
-
5
-
6
-
7
-
8
-
9
-
10
-
11
-
12
-
13
-
14
-
15
-
16
-
17
-
18
-
19
-
20
-
21
-
22
-
23
-
24
-
25
-
26
-
27
-
28
-
29
-
30
-
31
-
32
-
33
-
34
-
35
-
36
-
37
-
38
-
39
-
40
-
41
-
42
-
43
-
44
-
45
-
46
-
47
-
48
-
49
-
50
-
51
-
52
-
53
-
54
-
 55
55 -
 56
56 -
 57
57 -
 58
58 -
 59
59 -
 60
60 -
 61
61 -
 62
62 -
 63
63 -
 64
64 -
 65
65 -
 66
66 -
 67
67 -
 68
68 -
 69
69 -
 70
70 -
 71
71 -
 72
72 -
 73
73 -
 74
74 -
 75
75 -
76
-
77
-
78
-
79
-
80
-
81
-
82
-
83
-
84
-
85
-
86
-
87
-
88
-
89
-
90
-
91
-
92
-
93
-
94
-
95
-
96
-
97
-
98
-
99
-
100
-
101
-
102
-
103
-
104
-
105
-
106
-
107
-
108
-
109
-
110
-
111
-
112
-
113
-
114
-
115
-
116
-
117
-
118
-
119
-
120
-
121
-
122
-
123
-
124
-
125
-
126
-
127
-
128
-
129
-
130
-
131
-
132
-
133
-
134
-
135
-
136
-
137
-
138
-
139
-
140
-
141
-
142
-
143
-
144
-
145
-
146
-
147
-
148
-
149
-
150
-
151
-
152
-
153
-
154
-
155
-
156
-
157
-
158
-
159
-
160
-
161
-
162
-
163
-
164
-
165
-
166
-
167
-
168
-
169
-
170
-
171
-
172
-
173
-
174
-
175
-
176
-
177
-
178
-
179
-
180
-
181
-
182
-
183
-
184
-
185
-
186
-
187
-
188
-
189
-
190
-
191
-
192
-
193
-
194
-
195
-
196
-
197
-
198
-
199
-
200
-
201
-
202
-
203
-
204
-
205
-
206
-
207
-
208
-
209
-
210
-
211
-
212
-
213
-
214
-
215
-
216
-
217
-
218
-
219
-
220
 |
 |

adidas Group Annual Report 2008 061
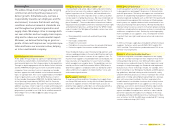
Targets versus actual key metrics
2007
Actual
2008
Initial Target
2008
Actual
2009
Outlook
Group sales (currency-neutral) 7% high-single-
digit increase
9% low- to mid-
single-digit
decline
adidas segment sales (currency-neutral) 12%
high-single-
digit increase
14% low- to mid-
single-digit
decline
Reebok segment sales (currency-neutral) 0%
low- to mid-
single-digit
increase
(2%) at least
stable
TaylorMade-adidas Golf segment sales (currency-neutral) 9% 1)
mid-single-
digit increase
7% low-single-
digit increase
Group gross margin 47.4% 47.5 to 48% 48.7% decline
adidas segment gross margin 47.4% increase 48.6%
Reebok segment gross margin 38.7% increase 37.0%
TaylorMade-adidas Golf segment gross margin 44.7% increase 44.3%
Group net other operating expenses and income (in % of sales) 39.2% increase 39.6% increase
adidas segment net other operating expenses and income (in % of sales) 35.6% increase 35.6%
Reebok segment net other operating expenses and income (in % of sales) 35.8% increase 38.7%
TaylorMade-adidas Golf segment net other operating expenses and income (in % of sales) 34.4% increase 32.1%
Group operating margin 9.2% at least 9.5% 9.9% decline
adidas segment operating margin 12.9% increase 14.0%
Reebok segment operating margin 4.7% increase (0.3%)
TaylorMade-adidas Golf segment operating margin 8.1% increase 9.6%
Net income growth (attributable to shareholders) 14% at least 15% 16% decline
Operating working capital (in % of net sales) 25.2%
further
reduction
24.5% further
reduction
Capital expenditure (€ in million) 2) 289 300 – 400 380 300 – 400
Net debt (€ in million) 1,766 maintain
2007 level
or reduce
2,189 reduction
1) On a like-for-like basis, excluding prior year sales related to the Greg Norman Collection wholesale business which was divested in November 2006.
2) Excluding acquisitions and fi nance leases.
Management appraisal of performance and targets
We communicate our Group’s fi nancial targets on an annual
basis. We also provide updates throughout the year as appro-
priate. In 2008, we achieved or exceeded all key fi nancial
targets we had set for the Group except for net borrowings,
which surpassed the prior year level. We outperformed macro-
economic and global industry growth see Economic and
Sector Development, p. 080, improved Group gross and operating
margins and increased earnings per share at a double-digit
rate.
By segment, development at adidas and TaylorMade-adidas
Golf exceeded our initial sales expectations while the Reebok
segment performed below initial expectations. At Reebok,
sales increases in the emerging markets, particularly in Asia
and in Eastern Europe, were more than offset by lower than
anticipated revenues in North America and the UK.
Our expectations for Group business performance in 2009
refl ect the deterioration of the global economy towards the end
of 2008 and at the beginning of 2009. We expect the recession-
ary environment in many major markets to have a signifi cant
negative impact on our Group’s fi nancial performance in 2009,
resulting in declines in both Group sales and earnings per
share. The degree of the decline in earnings per share will also
depend on the development of exchange rates. In 2010, assum-
ing an improving global economy, we are confi dent to increase
sales and earnings per share compared to 2009. We believe
our outlook is realistic within the scope of the current trading
environment. Compared to prior years, however, it entails a
higher degree of uncertainty. No material event between the
end of 2008 and the publication of this report has altered our
view see Subsequent Events and Outlook, p. 120.