Reebok 2008 Annual Report Download - page 63
Download and view the complete annual report
Please find page 63 of the 2008 Reebok annual report below. You can navigate through the pages in the report by either clicking on the pages listed below, or by using the keyword search tool below to find specific information within the annual report.-
 1
1 -
2
-
3
-
4
-
5
-
6
-
7
-
8
-
9
-
10
-
11
-
12
-
13
-
14
-
15
-
16
-
17
-
18
-
19
-
20
-
21
-
22
-
23
-
24
-
25
-
26
-
27
-
28
-
29
-
30
-
31
-
32
-
33
-
34
-
35
-
36
-
37
-
38
-
39
-
40
-
41
-
42
-
43
-
44
-
45
-
46
-
47
-
48
-
49
-
50
-
51
-
52
-
 53
53 -
 54
54 -
 55
55 -
 56
56 -
 57
57 -
 58
58 -
 59
59 -
 60
60 -
 61
61 -
 62
62 -
 63
63 -
 64
64 -
 65
65 -
 66
66 -
 67
67 -
 68
68 -
 69
69 -
 70
70 -
 71
71 -
 72
72 -
 73
73 -
74
-
75
-
76
-
77
-
78
-
79
-
80
-
81
-
82
-
83
-
84
-
85
-
86
-
87
-
88
-
89
-
90
-
91
-
92
-
93
-
94
-
95
-
96
-
97
-
98
-
99
-
100
-
101
-
102
-
103
-
104
-
105
-
106
-
107
-
108
-
109
-
110
-
111
-
112
-
113
-
114
-
115
-
116
-
117
-
118
-
119
-
120
-
121
-
122
-
123
-
124
-
125
-
126
-
127
-
128
-
129
-
130
-
131
-
132
-
133
-
134
-
135
-
136
-
137
-
138
-
139
-
140
-
141
-
142
-
143
-
144
-
145
-
146
-
147
-
148
-
149
-
150
-
151
-
152
-
153
-
154
-
155
-
156
-
157
-
158
-
159
-
160
-
161
-
162
-
163
-
164
-
165
-
166
-
167
-
168
-
169
-
170
-
171
-
172
-
173
-
174
-
175
-
176
-
177
-
178
-
179
-
180
-
181
-
182
-
183
-
184
-
185
-
186
-
187
-
188
-
189
-
190
-
191
-
192
-
193
-
194
-
195
-
196
-
197
-
198
-
199
-
200
-
201
-
202
-
203
-
204
-
205
-
206
-
207
-
208
-
209
-
210
-
211
-
212
-
213
-
214
-
215
-
216
-
217
-
218
-
219
-
220
 |
 |
adidas Group Annual Report 2008 059
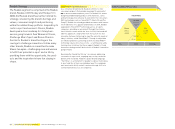
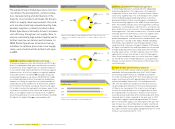
Key fi nancial metrics
1) Excluding acquisitions and fi nance leases.
The primary drivers central to enhancing operating margin are:
—
Sales and gross margin development: Management focuses
on identifying and exploiting opportunities that not only provide
for future growth, but also have potential to increase gross
margin (defi ned as gross profi t as a percentage of net sales).
Major levers for sustaining and enhancing our Group’s sales
and gross margin include optimising our product mix, increas-
ing the quality of distribution – with a particular focus on con-
trolled space – as well as supply chain effi ciency initiatives, and
the minimisation of clearance activities.
—
Operating expense control: We put high emphasis on tightly
controlling operating expenses to leverage the Group’s sales
growth through to the bottom line. This requires a particular
focus on ensuring fl exibility in the Group’s cost base. Market-
ing working budget is our largest operating expense. It is one
of the most important mechanisms for driving top-line growth.
Therefore, we are committed to improving the utilisation of our
marketing spend. This includes concentrating our communi-
cation efforts (including advertising, retail presentation and
public relations) on key global brand initiatives and focusing
our promotion spend on well-selected partnerships with top
events, leagues, clubs and athletes. We also aim to increase
operational effi ciency and reduce operating overhead expenses
as a percentage of sales. In this respect we constantly review
our operational structure – streamlining business processes,
eliminating redundancies and leveraging the scale of our
organisation. These measures may also be supplemented by
short-term initiatives such as temporarily curtailing opera-
tional investments, for example staff hiring.
We strive to maximise revenues and minimise costs by detailed
target setting, and we constantly monitor deviations in rolling
forecasts on a monthly basis. If necessary, action plans are
implemented to optimise the development of the Group’s oper-
ating performance.
Optimisation of non-operating components
Our Group also puts a high priority on the optimisation of non-
operating components such as fi nancial expenses and taxes,
as these items strongly impact the Group’s cash outfl ows and
therefore the Group’s free cash fl ow. Financial expenses are
managed centrally by our Group Treasury department see
Treasury, p. 093. The Group’s current and future tax expenditures
are optimised globally by our Group Taxes department.
Tight operating working capital management
Due to a comparatively low level of fi xed assets required in our
business, the effi ciency of the Group’s balance sheet depends
to a large degree on our operating working capital manage-
ment. Our key metric is operating working capital as a percent-
age of net sales. Monitoring the development of this key metric
facilitates the measurement of our progress in improving the
effi ciency of our business cycle. We have signifi cantly enhanced
working capital management over recent years through
continuous improvement of our Group’s inventories, accounts
receivable and accounts payable.
We strive to manage our inventory levels to meet market
demand and ensure fast replenishment. Inventory ageing is
controlled to reduce inventory obsolescence and to optimise
clearance activities. As a result, stock turn development is the
key performance indicator as it measures the number of times
average inventory is sold during a year, highlighting the effi -
ciency of capital locked up in products in relation to our Group’s
business. To minimise capital tied up in accounts receivable,
we strive to continuously improve collection efforts in order to
reduce the Days of Sales Outstanding (DSO) and improve the
ageing of accounts receivable. Likewise, we strive to continu-
ously optimise payment terms with our suppliers to best man-
age our accounts payable.
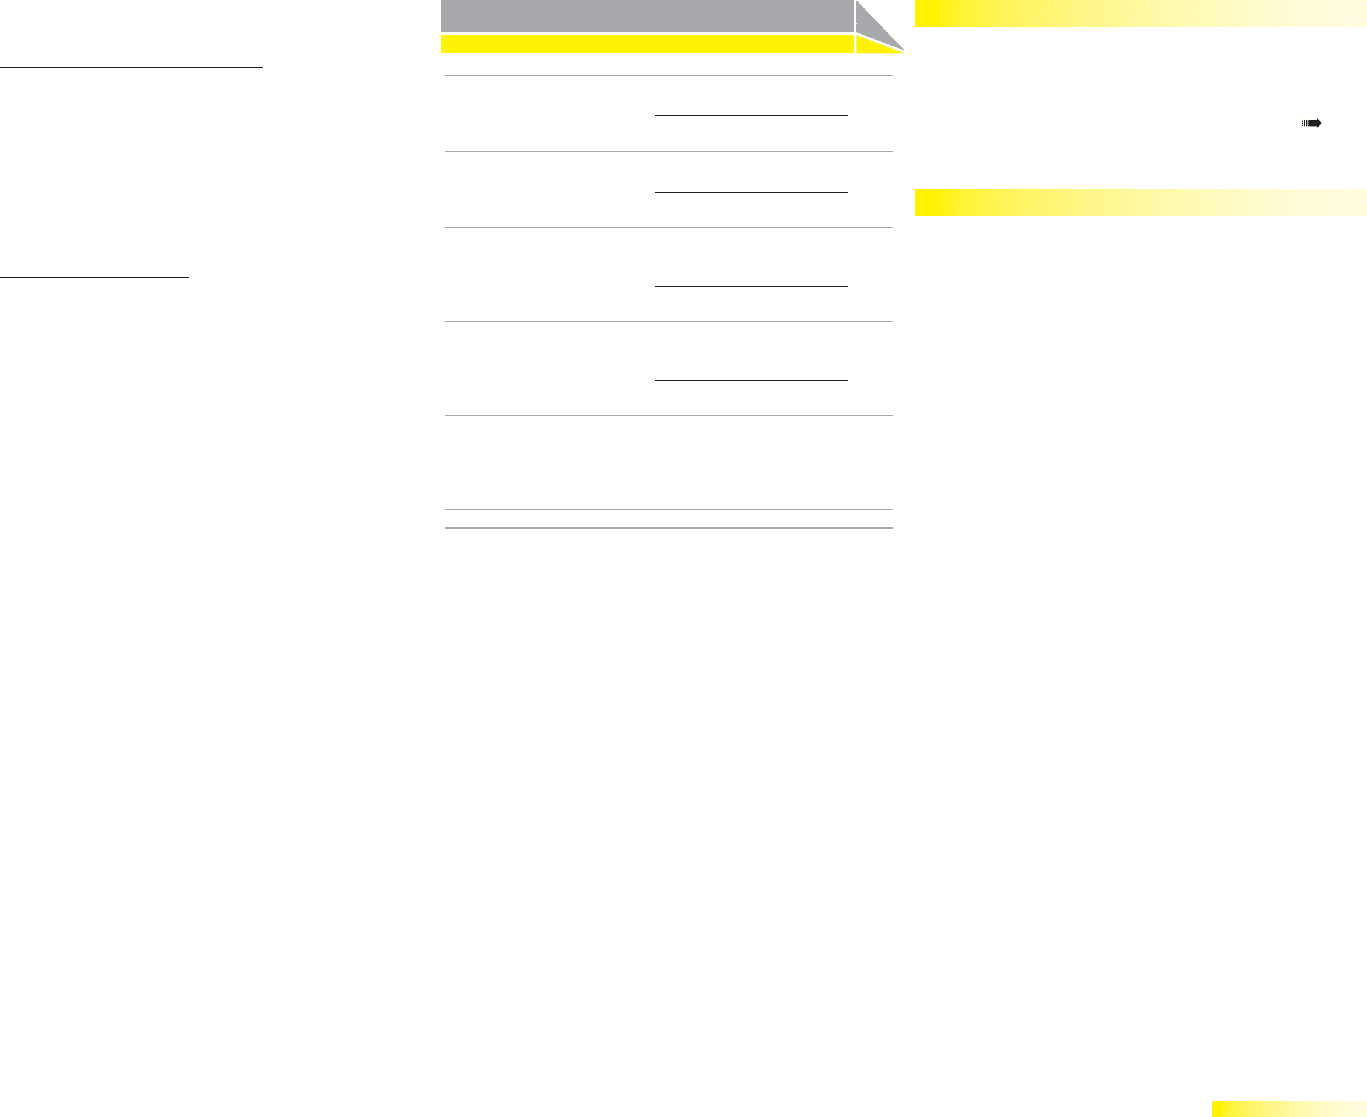
Gross margin Gross profi t
= × 100
Net sales
Operating margin Operating profi t
= × 100
Net sales
Average operating
working capital
Sum of operating working
capital at quarter-end
=
4
Operating working capital
in % of net sales
Average operating
working capital
= × 100
Net sales
Capital expenditure 1) =
Additions of property,
plant and equipment plus
intangible assets