Reebok 2008 Annual Report Download - page 106
Download and view the complete annual report
Please find page 106 of the 2008 Reebok annual report below. You can navigate through the pages in the report by either clicking on the pages listed below, or by using the keyword search tool below to find specific information within the annual report.-
 1
1 -
2
-
3
-
4
-
5
-
6
-
7
-
8
-
9
-
10
-
11
-
12
-
13
-
14
-
15
-
16
-
17
-
18
-
19
-
20
-
21
-
22
-
23
-
24
-
25
-
26
-
27
-
28
-
29
-
30
-
31
-
32
-
33
-
34
-
35
-
36
-
37
-
38
-
39
-
40
-
41
-
42
-
43
-
44
-
45
-
46
-
47
-
48
-
49
-
50
-
51
-
52
-
53
-
54
-
55
-
56
-
57
-
58
-
59
-
60
-
61
-
62
-
63
-
64
-
65
-
66
-
67
-
68
-
69
-
70
-
71
-
72
-
73
-
74
-
75
-
76
-
77
-
78
-
79
-
80
-
81
-
82
-
83
-
84
-
85
-
86
-
87
-
88
-
89
-
90
-
91
-
92
-
93
-
94
-
95
-
 96
96 -
 97
97 -
 98
98 -
 99
99 -
 100
100 -
 101
101 -
 102
102 -
 103
103 -
 104
104 -
 105
105 -
 106
106 -
 107
107 -
 108
108 -
 109
109 -
 110
110 -
 111
111 -
 112
112 -
 113
113 -
 114
114 -
 115
115 -
 116
116 -
117
-
118
-
119
-
120
-
121
-
122
-
123
-
124
-
125
-
126
-
127
-
128
-
129
-
130
-
131
-
132
-
133
-
134
-
135
-
136
-
137
-
138
-
139
-
140
-
141
-
142
-
143
-
144
-
145
-
146
-
147
-
148
-
149
-
150
-
151
-
152
-
153
-
154
-
155
-
156
-
157
-
158
-
159
-
160
-
161
-
162
-
163
-
164
-
165
-
166
-
167
-
168
-
169
-
170
-
171
-
172
-
173
-
174
-
175
-
176
-
177
-
178
-
179
-
180
-
181
-
182
-
183
-
184
-
185
-
186
-
187
-
188
-
189
-
190
-
191
-
192
-
193
-
194
-
195
-
196
-
197
-
198
-
199
-
200
-
201
-
202
-
203
-
204
-
205
-
206
-
207
-
208
-
209
-
210
-
211
-
212
-
213
-
214
-
215
-
216
-
217
-
218
-
219
-
220
 |
 |
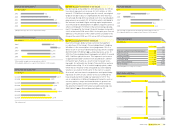
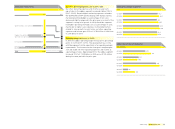
102 Group Management Report – Our Financial Year Business Performance by Segment — Reebok Business Performance
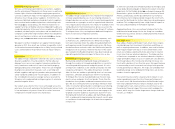
Reebok at a glance
€ in millions
2008 2007 Change
Net sales 2,148 2,333 (8%)
Gross profi t 795 902 (12%)
Gross margin 37.0% 38.7% (1.7pp)
Operating profi t (7) 109 (106%)
Operating margin (0.3%) 4.7% (5.0pp)
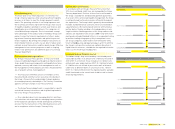
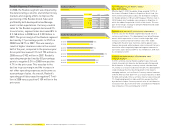
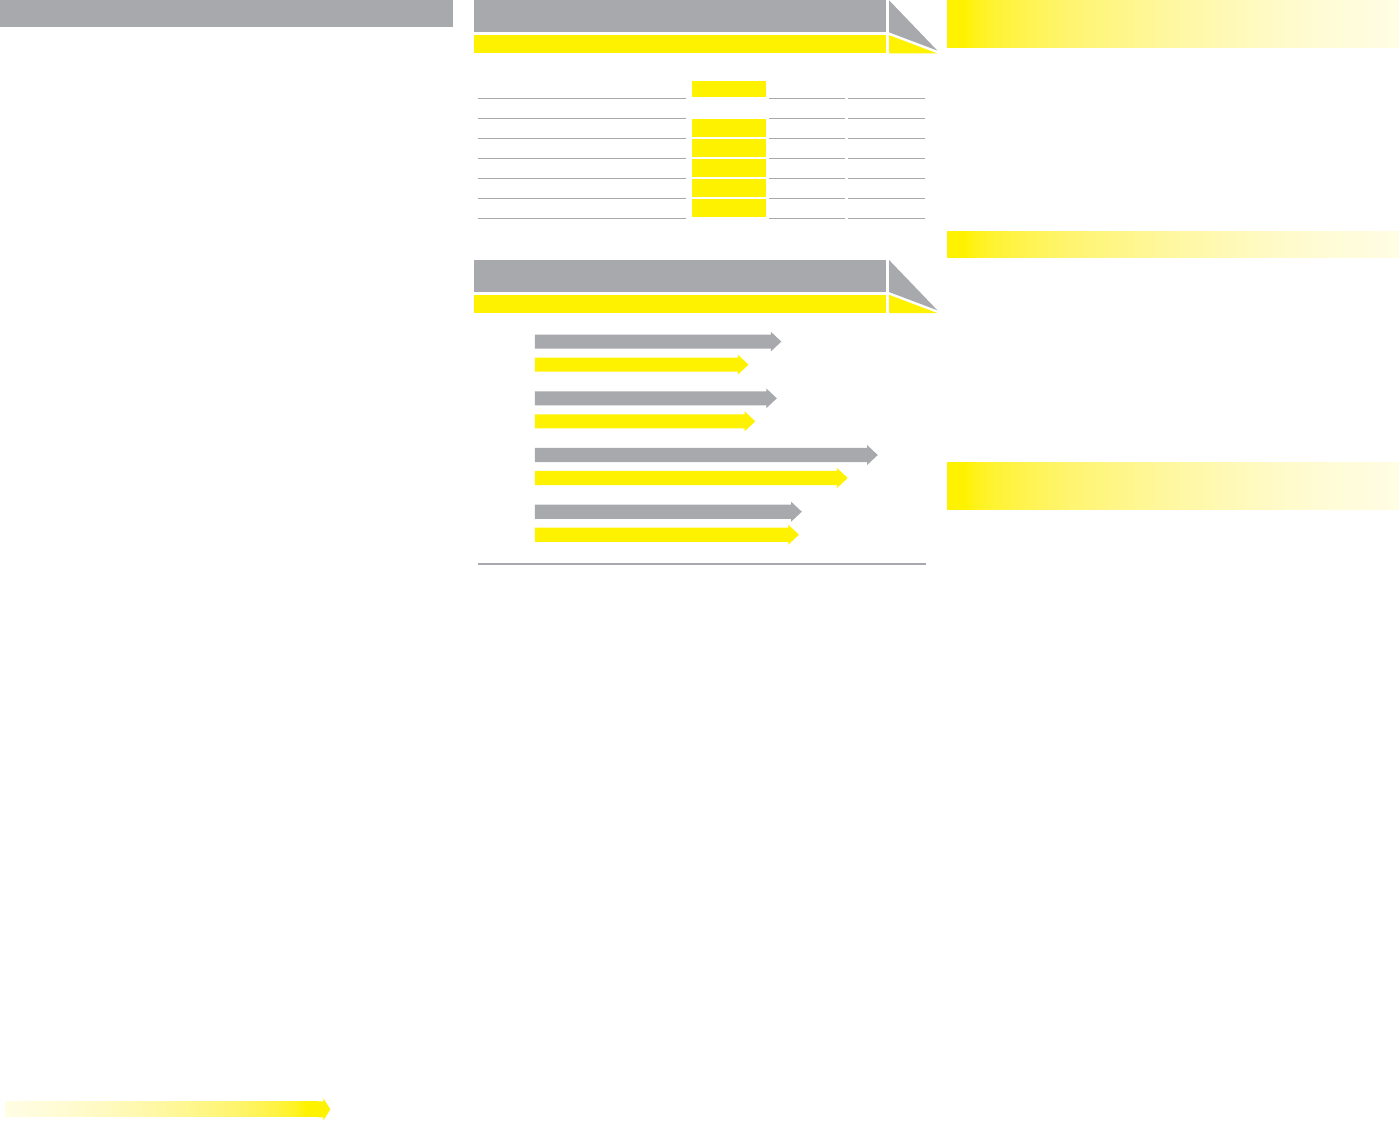
Reebok net sales by quarter
€ in millions
Q1 2007
Q1 2008
524
454
Q2 2007
Q2 2008
514
469
Q3 2007
Q3 2008
728
665
Q4 2007
Q4 2008
567
561
Reebok Business Performance
In 2008, the Reebok segment was impacted by
the deteriorating economic environment in key
markets and ongoing efforts to improve the
positioning of the Reebok brand. Sales and
profi tability both developed below Manage-
ment’s initial expectations. Currency-neutral
sales for the Reebok segment decreased 2%.
In euro terms, segment sales decreased 8% to
€ 2.148 billion in 2008 from € 2.333 billion in
2007. The gross margin of the Reebok segment
declined by 1.7 percentage points to 37.0% in
2008 from 38.7% in 2007. This was mainly a
result of higher clearance sales in the second
half of the year, compared to the previous year.
Gross profi t decreased 12% to € 795 million in
2008 versus € 902 million in 2007. Reebok’s
operating margin declined by 5.0 percentage
points to negative 0.3% in 2008 from positive
4.7% in the prior year. This was due to the
decline in gross margin and the increase in
net other operating expenses and income as
a percentage of sales. As a result, Reebok’s
operating profi t decreased to negative € 7 mil-
lion in 2008 versus positive € 109 million in the
prior year.
New companies in Latin America impact
sales and royalties
Effective April 1, 2008, the adidas Group acquired 99.99% of
the shares of Reebok Productos Esportivos Brasil Ltda. (for-
merly Comercial Vulcabras Ltda.), the distribution company
for Reebok products in Brazil and Paraguay. Effective June 2,
2008, Reebok also founded a new company in Argentina, in
which the adidas Group holds 99.99% of the shares. This was
part of the Group’s strategy to bring the Reebok brand under
direct control in all regions.
Segment sales decline 2% on a currency-neutral basis
In 2008, sales for the Reebok segment decreased 2% on a
currency-neutral basis. This development was below Manage-
ment’s initial expectation of a low- to mid-single-digit sales
increase. Currency-neutral footwear sales were stable
compared to the prior year. Currency-neutral apparel sales,
however, decreased, while hardware sales increased. Currency
translation effects negatively impacted segment revenues in
euro terms. Sales decreased 8% to € 2.148 billion in 2008 from
€ 2.333 billion in 2007.
Growth in emerging markets offset by lower sales
in mature markets
In 2008, currency-neutral Reebok segment sales increased
in both Asia and Latin America, but decreased in Europe and
North America. In Europe, currency-neutral sales declined
3%, mainly as a result of a decline in the UK. This development
could only be partly offset by strong growth in the region’s
emerging markets, such as Russia. Currency-neutral revenues
in North America were down 16% as a result of declines in both
the USA and Canada. In Asia, currency-neutral sales increased
7%. Double-digit growth in India and China was partly offset
by a decline in Japan. Currency-neutral sales in Latin America
increased 192%, due to the fi rst-time consolidation of Reebok’s
new companies in the second quarter of 2008.