Reebok 2008 Annual Report Download - page 200
Download and view the complete annual report
Please find page 200 of the 2008 Reebok annual report below. You can navigate through the pages in the report by either clicking on the pages listed below, or by using the keyword search tool below to find specific information within the annual report.-
 1
1 -
2
-
3
-
4
-
5
-
6
-
7
-
8
-
9
-
10
-
11
-
12
-
13
-
14
-
15
-
16
-
17
-
18
-
19
-
20
-
21
-
22
-
23
-
24
-
25
-
26
-
27
-
28
-
29
-
30
-
31
-
32
-
33
-
34
-
35
-
36
-
37
-
38
-
39
-
40
-
41
-
42
-
43
-
44
-
45
-
46
-
47
-
48
-
49
-
50
-
51
-
52
-
53
-
54
-
55
-
56
-
57
-
58
-
59
-
60
-
61
-
62
-
63
-
64
-
65
-
66
-
67
-
68
-
69
-
70
-
71
-
72
-
73
-
74
-
75
-
76
-
77
-
78
-
79
-
80
-
81
-
82
-
83
-
84
-
85
-
86
-
87
-
88
-
89
-
90
-
91
-
92
-
93
-
94
-
95
-
96
-
97
-
98
-
99
-
100
-
101
-
102
-
103
-
104
-
105
-
106
-
107
-
108
-
109
-
110
-
111
-
112
-
113
-
114
-
115
-
116
-
117
-
118
-
119
-
120
-
121
-
122
-
123
-
124
-
125
-
126
-
127
-
128
-
129
-
130
-
131
-
132
-
133
-
134
-
135
-
136
-
137
-
138
-
139
-
140
-
141
-
142
-
143
-
144
-
145
-
146
-
147
-
148
-
149
-
150
-
151
-
152
-
153
-
154
-
155
-
156
-
157
-
158
-
159
-
160
-
161
-
162
-
163
-
164
-
165
-
166
-
167
-
168
-
169
-
170
-
171
-
172
-
173
-
174
-
175
-
176
-
177
-
178
-
179
-
180
-
181
-
182
-
183
-
184
-
185
-
186
-
187
-
188
-
189
-
 190
190 -
 191
191 -
 192
192 -
 193
193 -
 194
194 -
 195
195 -
 196
196 -
 197
197 -
 198
198 -
 199
199 -
 200
200 -
 201
201 -
 202
202 -
 203
203 -
 204
204 -
 205
205 -
 206
206 -
 207
207 -
 208
208 -
 209
209 -
 210
210 -
211
-
212
-
213
-
214
-
215
-
216
-
217
-
218
-
219
-
220
 |
 |
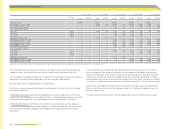
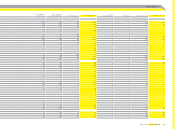
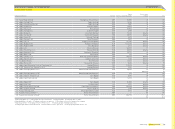
196 Consolidated Financial Statements Statement of Movements of Intangible and Tangible Assets and Financial Assets
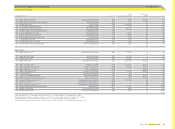
Statement of movements of intangible and tangible assets and fi nancial assets
€ in millions
Goodwill Trademarks
Software, patents
and concessions Total intangible assets Land and buildings
Acquisition cost
January 1, 2007 1,516 1,454 447 3,417 484
Currency effect (80) (156) (29) (265) (31)
Additions — — 59 59 24
Increase in companies consolidated — — — — —
Transfers to assets held for sale — (7) (1) (7) (20)
Decrease in companies consolidated — — — — —
Transfers ———— 3
Disposals — — (35) (35) (30)
December 31, 2007/January 1, 2008 1,436 1,291 441 3,169 430
Currency effect 45 75 12 131 5
Additions 0 0 60 60 21
Increase in companies consolidated 18 27 20 65 12
Transfers from assets held for sale — — — — 44
Transfers to assets held for sale — (3) — (4) (6)
Decrease in companies consolidated — — — — —
Transfers — — (10) (10) 10
Disposals — 0 (6) (6) (27)
December 31, 2008 1,499 1,390 517 3,406 489
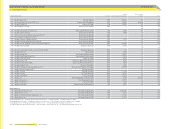
Accumulated depreciation /amortisation
January 1, 2007 — — 224 224 104
Currency effect — — (15) (15) (9)
Additions — — 64 64 22
Impairment ———— 1
Write-ups —————
Increase in companies consolidated — — — — —
Transfers to assets held for sale — — (1) (1) (10)
Decrease in companies consolidated — — — — —
Transfers —————
Disposals — — (25) (25) (16)
December 31, 2007/January 1, 2008 — — 247 247 92
Currency effect — — 10 10 2
Additions — 0 61 61 25
Impairment — — — — 1
Write-ups —————
Increase in companies consolidated — — — — —
Transfers from assets held for sale — — — — 3
Transfers to assets held for sale — — — — —
Decrease in companies consolidated — — — — —
Transfers — — — — (1)
Disposals — — (4) (4) (8)
December 31, 2008 — 0 313 313 116
Net carrying amount
December 31, 2006 1,516 1,454 223 3,193 380
December 31, 2007 1,436 1,291 194 2,922 338
December 31, 2008 1,499 1,390 204 3,093 373
Rounding differences may arise in percentages and totals,