Reebok 2008 Annual Report Download - page 87
Download and view the complete annual report
Please find page 87 of the 2008 Reebok annual report below. You can navigate through the pages in the report by either clicking on the pages listed below, or by using the keyword search tool below to find specific information within the annual report.-
 1
1 -
2
-
3
-
4
-
5
-
6
-
7
-
8
-
9
-
10
-
11
-
12
-
13
-
14
-
15
-
16
-
17
-
18
-
19
-
20
-
21
-
22
-
23
-
24
-
25
-
26
-
27
-
28
-
29
-
30
-
31
-
32
-
33
-
34
-
35
-
36
-
37
-
38
-
39
-
40
-
41
-
42
-
43
-
44
-
45
-
46
-
47
-
48
-
49
-
50
-
51
-
52
-
53
-
54
-
55
-
56
-
57
-
58
-
59
-
60
-
61
-
62
-
63
-
64
-
65
-
66
-
67
-
68
-
69
-
70
-
71
-
72
-
73
-
74
-
75
-
76
-
 77
77 -
 78
78 -
 79
79 -
 80
80 -
 81
81 -
 82
82 -
 83
83 -
 84
84 -
 85
85 -
 86
86 -
 87
87 -
 88
88 -
 89
89 -
 90
90 -
 91
91 -
 92
92 -
 93
93 -
 94
94 -
 95
95 -
 96
96 -
 97
97 -
98
-
99
-
100
-
101
-
102
-
103
-
104
-
105
-
106
-
107
-
108
-
109
-
110
-
111
-
112
-
113
-
114
-
115
-
116
-
117
-
118
-
119
-
120
-
121
-
122
-
123
-
124
-
125
-
126
-
127
-
128
-
129
-
130
-
131
-
132
-
133
-
134
-
135
-
136
-
137
-
138
-
139
-
140
-
141
-
142
-
143
-
144
-
145
-
146
-
147
-
148
-
149
-
150
-
151
-
152
-
153
-
154
-
155
-
156
-
157
-
158
-
159
-
160
-
161
-
162
-
163
-
164
-
165
-
166
-
167
-
168
-
169
-
170
-
171
-
172
-
173
-
174
-
175
-
176
-
177
-
178
-
179
-
180
-
181
-
182
-
183
-
184
-
185
-
186
-
187
-
188
-
189
-
190
-
191
-
192
-
193
-
194
-
195
-
196
-
197
-
198
-
199
-
200
-
201
-
202
-
203
-
204
-
205
-
206
-
207
-
208
-
209
-
210
-
211
-
212
-
213
-
214
-
215
-
216
-
217
-
218
-
219
-
220
 |
 |
adidas Group Annual Report 2008 083
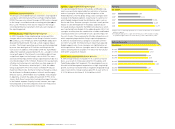
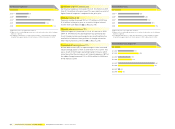
2008 net sales by segment 1)
1) HQ /Consolidation accounts for less than 1% of sales.
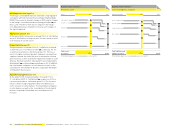
2008 net sales by region 1)
1) Excluding HQ /Consolidation.
adidas 72%
Europe 43%
Asia 25%
TaylorMade-
adidas Golf 8%
Reebok 20%
Latin America 8%
North America 24%
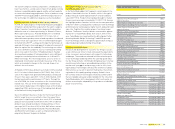
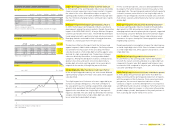
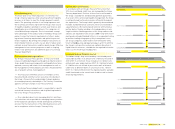
Net sales by region
€ in millions
Europe
North
America Asia
Latin
America Total 1)
2004 2) 3,068 1,332 1,192 224 5,860
2005 2) 3,166 1,561 1,523 319 6,636
2006 3) 4,162 3,234 2,020 499 10,084
2007 4,369 2,929 2,254 657 10,299
2008 4,665 2,520 2,662 893 10,799
1) Including HQ /Consolidation.
2) Figures refl ect continuing operations as a result of the divestiture of the Salomon
business segment.
3) Including Reebok business segment from February 1, 2006 onwards. Including
Greg Norman apparel business from February 1, 2006 to November 30, 2006.
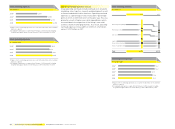
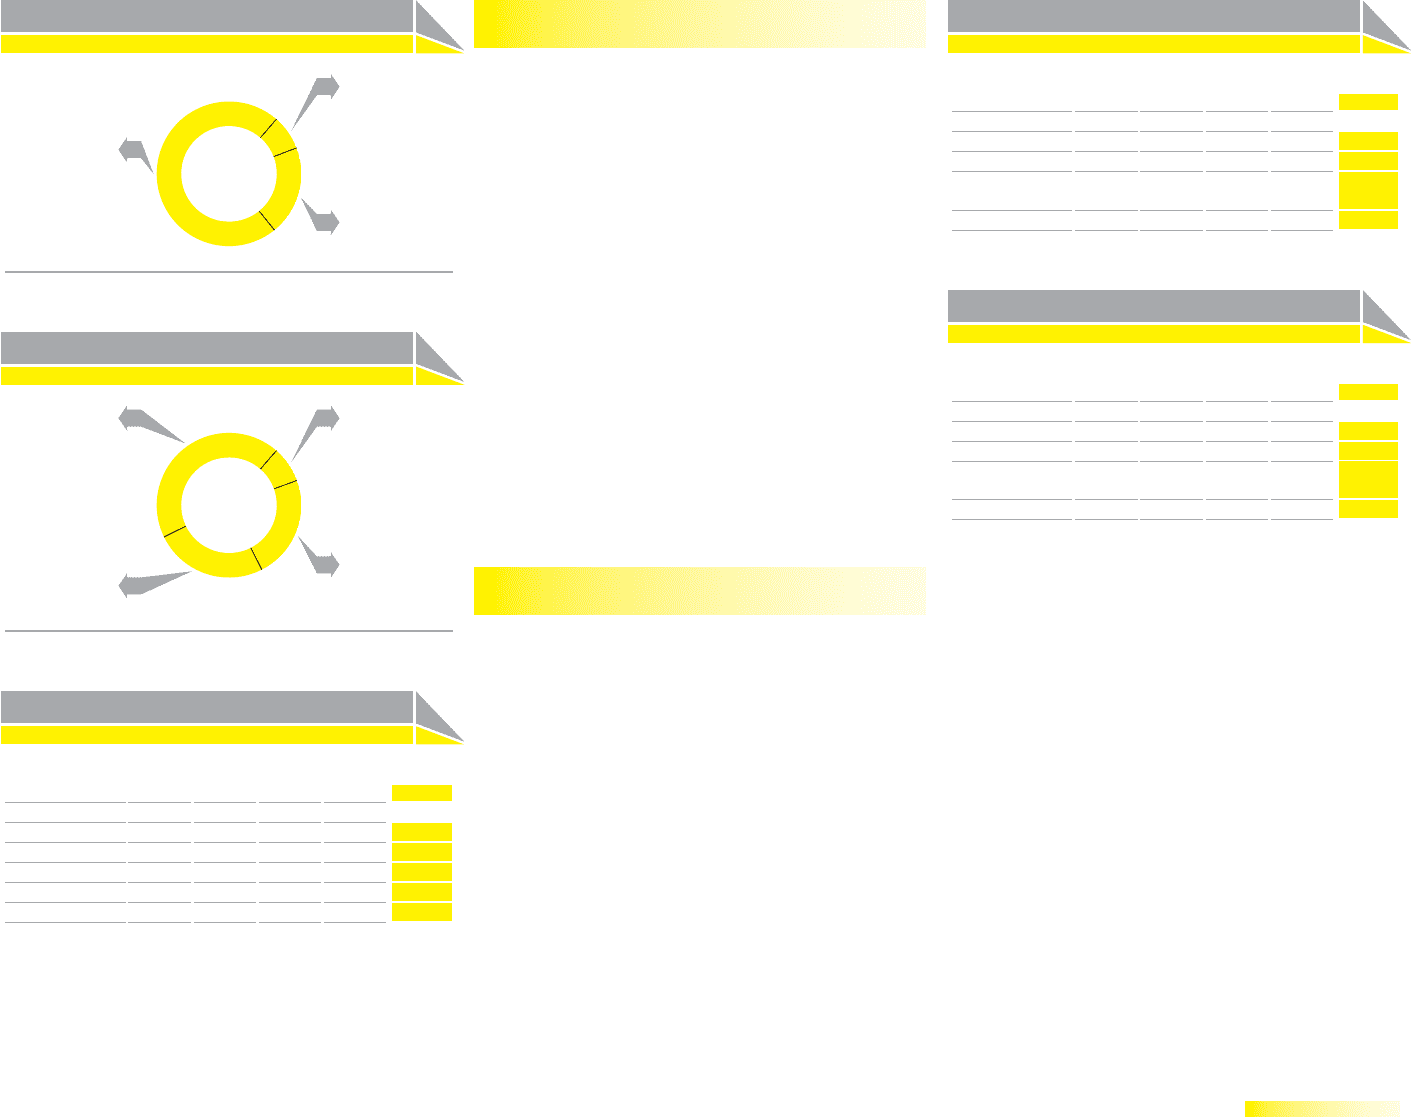
2008 net sales growth (currency-neutral) 1)
by segment and region in %
Europe
North
America Asia
Latin
America Total
adidas 13 (3) 24 21 14
Reebok (3) (16) 7 192 (2)
TaylorMade-
adidas Golf 17 3 10 38 7
Total 11 (8) 20 42 9
1) Versus the prior year.
2008 net sales growth (in €) 1)
by segment and region in %
Europe
North
America Asia
Latin
America Total
adidas 10 (10) 23 16 10
Reebok (8) (22) (1) 170 (8)
TaylorMade-
adidas Golf 0 (4) 8 28 1
Total 7 (14) 18 36 5
1) Versus the prior year.
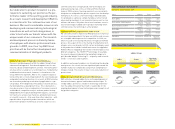
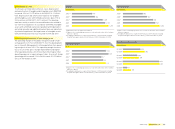
adidas and TaylorMade-adidas Golf drive
top-line performance
The adidas segment was the most signifi cant contributor to
Group sales growth in 2008. Currency-neutral adidas segment
revenues increased 14% during the period, driven by double-
digit increases in all major performance categories. Currency-
neutral sales in the Reebok segment decreased 2% versus
the prior year. Growth in the running category was offset by
declines in most other categories. At TaylorMade-adidas
Golf, currency-neutral revenues increased 7%, due to posi-
tive sales momentum in apparel, footwear, balls and putters.
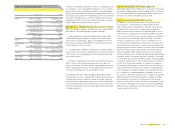
Sales recorded in the HQ /Consolidation segment, which refl ect
revenues not attributable to the adidas, Reebok or TaylorMade-
adidas Golf segments, decreased 63% on a currency-neutral
basis. This development was mainly due to the expiration of our
sourcing cooperation agreement with Amer Sports Corporation
in February 2008.
Currency translation effects negatively impacted sales in
all segments in euro terms. adidas sales increased 10% to
€ 7.821 billion in 2008 from € 7.113 billion in 2007. Sales at
Reebok decreased 8% to € 2.148 billion versus € 2.333 billion
in the prior year. TaylorMade-adidas Golf sales increased 1%
to € 812 million in 2008 from € 804 million in 2007. HQ /Consol-
idation sales decreased 64% to € 18 million from € 49 million
in the prior year.
Double-digit currency-neutral sales increase
in nearly all regions
adidas Group sales grew at double-digit rates on a currency-
neutral basis in all regions except North America in 2008.
Group sales in Europe grew 11% on a currency-neutral basis
as a result of strong growth in emerging markets. In North
America, Group sales declined 8% on a currency-neutral basis
due to lower sales in the USA. Sales for the adidas Group in
Asia increased 20% on a currency-neutral basis, driven by
particularly strong growth in China. In Latin America, sales
grew 42% on a currency-neutral basis, with double-digit
increases coming from most of the region’s major markets,
supported by the new Reebok companies in Brazil /Paraguay
and Argentina.