Reebok 2008 Annual Report Download - page 69
Download and view the complete annual report
Please find page 69 of the 2008 Reebok annual report below. You can navigate through the pages in the report by either clicking on the pages listed below, or by using the keyword search tool below to find specific information within the annual report.-
 1
1 -
2
-
3
-
4
-
5
-
6
-
7
-
8
-
9
-
10
-
11
-
12
-
13
-
14
-
15
-
16
-
17
-
18
-
19
-
20
-
21
-
22
-
23
-
24
-
25
-
26
-
27
-
28
-
29
-
30
-
31
-
32
-
33
-
34
-
35
-
36
-
37
-
38
-
39
-
40
-
41
-
42
-
43
-
44
-
45
-
46
-
47
-
48
-
49
-
50
-
51
-
52
-
53
-
54
-
55
-
56
-
57
-
58
-
 59
59 -
 60
60 -
 61
61 -
 62
62 -
 63
63 -
 64
64 -
 65
65 -
 66
66 -
 67
67 -
 68
68 -
 69
69 -
 70
70 -
 71
71 -
 72
72 -
 73
73 -
 74
74 -
 75
75 -
 76
76 -
 77
77 -
 78
78 -
 79
79 -
80
-
81
-
82
-
83
-
84
-
85
-
86
-
87
-
88
-
89
-
90
-
91
-
92
-
93
-
94
-
95
-
96
-
97
-
98
-
99
-
100
-
101
-
102
-
103
-
104
-
105
-
106
-
107
-
108
-
109
-
110
-
111
-
112
-
113
-
114
-
115
-
116
-
117
-
118
-
119
-
120
-
121
-
122
-
123
-
124
-
125
-
126
-
127
-
128
-
129
-
130
-
131
-
132
-
133
-
134
-
135
-
136
-
137
-
138
-
139
-
140
-
141
-
142
-
143
-
144
-
145
-
146
-
147
-
148
-
149
-
150
-
151
-
152
-
153
-
154
-
155
-
156
-
157
-
158
-
159
-
160
-
161
-
162
-
163
-
164
-
165
-
166
-
167
-
168
-
169
-
170
-
171
-
172
-
173
-
174
-
175
-
176
-
177
-
178
-
179
-
180
-
181
-
182
-
183
-
184
-
185
-
186
-
187
-
188
-
189
-
190
-
191
-
192
-
193
-
194
-
195
-
196
-
197
-
198
-
199
-
200
-
201
-
202
-
203
-
204
-
205
-
206
-
207
-
208
-
209
-
210
-
211
-
212
-
213
-
214
-
215
-
216
-
217
-
218
-
219
-
220
 |
 |
adidas Group Annual Report 2008 065
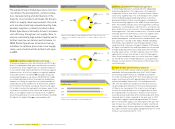
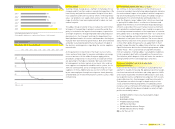
Apparel production by region 1)
1) Figures only include adidas, Reebok and adidas Golf.
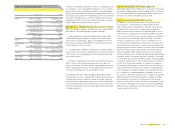
Hardware production by region 1)
1) Figures only include adidas and Reebok.
Asia 98%
Asia 83%
Europe 2%
Americas 5%
Europe 12%
Rockport purchased approximately 9 million pairs of footwear
in 2008, which represents a decrease of 17% versus the prior
year. Products were primarily sourced from factories in China
(72%), Vietnam (17%), Indonesia (8%) and Brazil (3%). The larg-
est factory accounted for 25% of the total sourcing volume of
the Rockport brand.
Volume of apparel production increases
In 2008, we sourced 83% of the total apparel volume for
adidas, Reebok and adidas Golf from Asia (2007: 82%). The
higher proportion of Asian-sourced apparel was attribut-
able to continued sales growth in Asia, which in turn required
higher sourcing volumes from the region. Europe remained
the second largest apparel sourcing region, representing 12%
of the volume (2007: 13%). The Americas accounted for 5% of
the volume (2007: 5%). China was the largest source coun-
try, representing 36% of the produced volume, followed by
Thailand with 14% and Indonesia with 10%. The only signifi -
cant change compared to the prior year was in China whose
overall representation increased 5 percentage points due to
the strong growth in apparel sales in that market in 2008. In
total, our suppliers produced approximately 284 million units
of apparel in 2008 (2007: approx. 252 million units). The largest
apparel factory produced approximately 10% of this apparel
volume in 2008 (2007: 12%). In addition, Reebok-CCM Hockey
sourced around 3 million units of apparel (game wear, jerseys
and headwear) in 2008. The vast majority of this volume was
also produced in Asia, while small portions were sourced from
the Americas (particularly Canada) and Europe. The Sports
Licensed Division sourced approximately 22 million units of
apparel and 17 million units of headwear (2007: 21 million and
18 million, respectively). The majority of purchased apparel
products was sourced as unfi nished goods from Central
America (58%) and Asia (10%), and was subsequently fi nished
in our own screen-printing facilities in the USA. On the other
hand, the majority of headwear sourced was fi nished products
manufactured in Asia (97%) and the USA (3%).
Approximately 65% of adidas and Reebok branded
hardware produced in China
In 2008, the vast majority (i.e. 98%) of adidas and Reebok
branded hardware products, such as balls and bags, was also
produced in Asia (2007: 96%). China remained our largest
source country, accounting for 65% of the sourced volume,
followed by Vietnam with 21% and Pakistan with 10%. The
remaining 4% was sourced via other Asian and European coun-
tries. The total 2008 hardware sourcing volume was approxi-
mately 42 million units (2007: approx. 39 million units) with the
largest factory accounting for 30% of production.
TaylorMade and Reebok-CCM Hockey sourced 93% and 75% of
their hardware volumes from Asia, respectively (2007: 92% and
70%). In addition, both brands sourced a small portion of hard-
ware products in the Americas. At TaylorMade, the majority of
golf club components were manufactured by suppliers in China
and assembled by TaylorMade in the USA, China and Japan.
Unchanged vision: closest to every consumer
The vision of Global Operations is to be closest to every con-
sumer. This means meeting consumer demand in various
distribution channels with the right product (in terms of quality,
size, colour, style and material) in the right store at the right
time.
In 2008, we had further evidence of the success of our efforts,
most visibly with the Beijing Olympic Games. In total, we
shipped 2.9 million units, with many produced on very short
leadtimes (e.g. more than 210,000 in less than seven days).
The fl exibility of our supply chain even allowed us to success-
fully replenish 300,000 units that were unplanned, sometimes
in as little as nine days after order placement. We achieved
similar levels of service to our customers during the UEFA
EURO 2008™ tournament and the UEFA Champions League
fi nal. Our ability to deliver on short leadtimes and continuous
replenish ment needs during large, global events such as these
shows that we are moving closer to realising our vision.
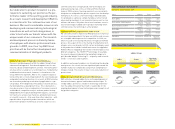
Apparel production 1)
in million units
2006 225
2007 252
2008 284
1) Figures only include adidas, Reebok and adidas Golf.