Reebok 2008 Annual Report Download - page 103
Download and view the complete annual report
Please find page 103 of the 2008 Reebok annual report below. You can navigate through the pages in the report by either clicking on the pages listed below, or by using the keyword search tool below to find specific information within the annual report.-
 1
1 -
2
-
3
-
4
-
5
-
6
-
7
-
8
-
9
-
10
-
11
-
12
-
13
-
14
-
15
-
16
-
17
-
18
-
19
-
20
-
21
-
22
-
23
-
24
-
25
-
26
-
27
-
28
-
29
-
30
-
31
-
32
-
33
-
34
-
35
-
36
-
37
-
38
-
39
-
40
-
41
-
42
-
43
-
44
-
45
-
46
-
47
-
48
-
49
-
50
-
51
-
52
-
53
-
54
-
55
-
56
-
57
-
58
-
59
-
60
-
61
-
62
-
63
-
64
-
65
-
66
-
67
-
68
-
69
-
70
-
71
-
72
-
73
-
74
-
75
-
76
-
77
-
78
-
79
-
80
-
81
-
82
-
83
-
84
-
85
-
86
-
87
-
88
-
89
-
90
-
91
-
92
-
 93
93 -
 94
94 -
 95
95 -
 96
96 -
 97
97 -
 98
98 -
 99
99 -
 100
100 -
 101
101 -
 102
102 -
 103
103 -
 104
104 -
 105
105 -
 106
106 -
 107
107 -
 108
108 -
 109
109 -
 110
110 -
 111
111 -
 112
112 -
 113
113 -
114
-
115
-
116
-
117
-
118
-
119
-
120
-
121
-
122
-
123
-
124
-
125
-
126
-
127
-
128
-
129
-
130
-
131
-
132
-
133
-
134
-
135
-
136
-
137
-
138
-
139
-
140
-
141
-
142
-
143
-
144
-
145
-
146
-
147
-
148
-
149
-
150
-
151
-
152
-
153
-
154
-
155
-
156
-
157
-
158
-
159
-
160
-
161
-
162
-
163
-
164
-
165
-
166
-
167
-
168
-
169
-
170
-
171
-
172
-
173
-
174
-
175
-
176
-
177
-
178
-
179
-
180
-
181
-
182
-
183
-
184
-
185
-
186
-
187
-
188
-
189
-
190
-
191
-
192
-
193
-
194
-
195
-
196
-
197
-
198
-
199
-
200
-
201
-
202
-
203
-
204
-
205
-
206
-
207
-
208
-
209
-
210
-
211
-
212
-
213
-
214
-
215
-
216
-
217
-
218
-
219
-
220
 |
 |

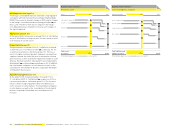
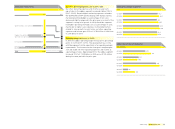
adidas Group Annual Report 2008 099
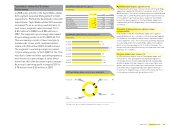
adidas at a glance
€ in millions
2008 2007 Change
Net sales 7,821 7,113 10%
Gross profi t 3,802 3,370 13%
Gross margin 48.6% 47.4% 1.2pp
Operating profi t 1,098 920 19%
Operating margin 14.0% 12.9% 1.1pp
adidas net sales by quarter
€ in millions
Q1 2007
Q1 2008
1,819
1,968
Q2 2007
Q2 2008
1,635
1,818
Q3 2007
Q3 2008
2,012
2,218
Q4 2007
Q4 2008
1,648
1,817
2008 adidas net sales by division
Sport
Performance 80%
Sport Style 20%
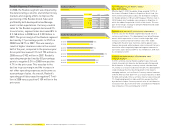
adidas Business Performance
In 2008, sales growth in the adidas segment
exceeded Management’s initial expectations.
Profi tability developed in line with expectations.
Currency-neutral sales in the adidas segment
increased 14%. In euro terms, segment sales
grew 10% to € 7.821 billion in 2008 from
€ 7.113 billion in 2007. Gross margin increased
1.2 percentage points to a record annual level of
48.6% (2007: 47.4%). This was mainly driven by
an improving regional mix, further own-retail
expansion and a more favourable product mix.
Gross profi t grew 13% to € 3.802 billion in 2008
from € 3.370 billion in 2007. As a result of the
positive gross margin development and stable
net other operating expenses and income
as a percentage of sales, operating margin
increased 1.1 percentage points to 14.0% (2007:
12.9%). Operating profi t increased 19% to
€ 1.098 billion in 2008 versus € 920 million
in 2007.
Acquisition of Textronics, Inc.
In September 2008, the adidas segment acquired US-based
Textronics, Inc. Textronics is a specialist in the development of
wearable sensors for use in fi tness monitoring. The acquisition
did not have a material impact on adidas results in 2008.
Currency-neutral segment sales grow 14%
In 2008, revenues for the adidas segment grew 14% on a
currency-neutral basis. This development clearly exceeded
Management’s initial expectation of a high-single-digit sales
increase. Currency-neutral footwear, apparel and hardware
revenues all increased at double-digit rates. Currency trans-
lation effects negatively impacted segment revenues in euro
terms. adidas sales grew 10% in euro terms to € 7.821 billion
in 2008 from € 7.113 billion in 2007.
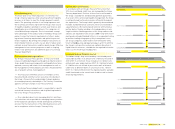
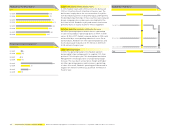
Currency-neutral adidas sales grow at double-digit
rates in nearly all regions
In 2008, currency-neutral sales for the adidas segment grew
at double-digit rates in all regions except North America,
where sales declined. Revenues in Europe grew 13% on a
currency-neutral basis, mainly driven by double-digit increases
in emerging markets. Currency-neutral adidas sales in North
America decreased 3% as a result of the diffi cult retail environ-
ment in the USA. Sales in Asia improved 24% on a currency-
neutral basis, due to double-digit increases in nearly all major
markets, in particular China. In Latin America, currency-
neutral sales grew 21%, driven by double-digit increases in all
markets.
Currency translation effects negatively impacted sales in euro
terms in all regions. Sales in Europe grew 10% in euro terms
to € 3.879 billion in 2008 from € 3.526 billion in 2007. Rev-
enues in North America decreased 10% to € 1.149 billion in
2008 from € 1.275 billion in 2007. Sales in Asia increased 23%
to € 2.090 billion in 2008 from € 1.703 billion in 2007, and rev-
enues in Latin America improved 16% to € 660 million in 2008
versus € 568 million in the prior year.