Reebok 2008 Annual Report Download - page 120
Download and view the complete annual report
Please find page 120 of the 2008 Reebok annual report below. You can navigate through the pages in the report by either clicking on the pages listed below, or by using the keyword search tool below to find specific information within the annual report.-
 1
1 -
2
-
3
-
4
-
5
-
6
-
7
-
8
-
9
-
10
-
11
-
12
-
13
-
14
-
15
-
16
-
17
-
18
-
19
-
20
-
21
-
22
-
23
-
24
-
25
-
26
-
27
-
28
-
29
-
30
-
31
-
32
-
33
-
34
-
35
-
36
-
37
-
38
-
39
-
40
-
41
-
42
-
43
-
44
-
45
-
46
-
47
-
48
-
49
-
50
-
51
-
52
-
53
-
54
-
55
-
56
-
57
-
58
-
59
-
60
-
61
-
62
-
63
-
64
-
65
-
66
-
67
-
68
-
69
-
70
-
71
-
72
-
73
-
74
-
75
-
76
-
77
-
78
-
79
-
80
-
81
-
82
-
83
-
84
-
85
-
86
-
87
-
88
-
89
-
90
-
91
-
92
-
93
-
94
-
95
-
96
-
97
-
98
-
99
-
100
-
101
-
102
-
103
-
104
-
105
-
106
-
107
-
108
-
109
-
 110
110 -
 111
111 -
 112
112 -
 113
113 -
 114
114 -
 115
115 -
 116
116 -
 117
117 -
 118
118 -
 119
119 -
 120
120 -
 121
121 -
 122
122 -
 123
123 -
 124
124 -
 125
125 -
 126
126 -
 127
127 -
 128
128 -
 129
129 -
 130
130 -
131
-
132
-
133
-
134
-
135
-
136
-
137
-
138
-
139
-
140
-
141
-
142
-
143
-
144
-
145
-
146
-
147
-
148
-
149
-
150
-
151
-
152
-
153
-
154
-
155
-
156
-
157
-
158
-
159
-
160
-
161
-
162
-
163
-
164
-
165
-
166
-
167
-
168
-
169
-
170
-
171
-
172
-
173
-
174
-
175
-
176
-
177
-
178
-
179
-
180
-
181
-
182
-
183
-
184
-
185
-
186
-
187
-
188
-
189
-
190
-
191
-
192
-
193
-
194
-
195
-
196
-
197
-
198
-
199
-
200
-
201
-
202
-
203
-
204
-
205
-
206
-
207
-
208
-
209
-
210
-
211
-
212
-
213
-
214
-
215
-
216
-
217
-
218
-
219
-
220
 |
 |

116 Group Management Report – Our Financial Year Risk and Opportunity Report
—
Exchange rates are assumed at a year-end value instead
of the more relevant sales-weighted average fi gure, which we
utilise internally to better refl ect both the seasonality of our
business and intra-year currency fl uctuations.
—
The underlying forecasted cash fl ow exposure (which
the hedge instrument mainly relates to) is not required to be
revalued in this analysis.
—
Operational issues, such as potential discounts to key
accounts, who have high transparency regarding the impacts
of currency on our sourcing activities (due to their own
private label sourcing efforts), are also excluded from this
presentation.
Utilising a centralised currency risk management system, our
Group hedges currency needs for projected sourcing require-
ments on a rolling 12- to 24-month basis see Treasury, p. 093.
Our goal is to have the vast majority of our hedging volume
secured six months prior to the start of a given season. In the
fi rst half of 2008, we took advantage of the strong euro versus
the US dollar to increase our hedging timeline from a rolling
12- to 18-month
basis to a rolling 12- to 24-month basis. In
rare instances, hedges are contracted beyond the 24-month
horizon. The Group also largely hedges balance sheet risks.
Due to our
strong global position, we are able to minimise
currency risk to a large extent by utilising natural hedges.
Nevertheless, our net US dollar exposure after natural hedges
calculated for the next year was roughly € 2.5 billion at year-
end 2008, which we hedged using forward contracts, currency
options and currency swaps. Our Group’s Treasury Policy
allows us to utilise hedging instruments, such as currency
options or option combinations, which provide protection
while – at the same time – retain the potential to benefi t from
future favourable exchange rate developments in the fi nancial
markets.
As 2009 hedging has almost been completed, it is clear that
conversion rates on major currencies will be similar to those
of 2008. However, volume forecast variances, greater currency
volatility and a larger portion of our business in emerging mar-
kets create currency challenges in 2009. In addition, translation
impacts from the conversion of non-euro- denominated results
into our Group’s functional currency, the euro, could lead to a
material negative or positive impact on our Group’s fi nancial
performance. Consequently, we believe the likelihood of
currency risk impacting our 2009 fi nancial performance and
the potential fi nancial impact have increased to medium.
Interest rate risks
Changes in market interest rates affect future interest pay-
ments for variable-interest liabilities. As a result, signifi cant
interest rate increases can have an adverse effect on the
Group’s profi tability, liquidity and fi nancial position. The acqui-
sition of Reebok in 2006 led to an increase in interest rate risks
due to the higher fi nancing requirements and the resulting
higher weighted-average interest rate on the Group’s fi nancing
structure see Treasury, p. 093.
In line with IFRS 7 requirements, we have analysed the impact
of changes in the Group’s most important interest rates on net
income and shareholders’ equity. The effect of interest rate
changes on future cash fl ows is excluded from this analysis.
Nevertheless, accrued interest, which is recognised as a
liability, has been re-calculated based on the hypothetical
market interest rates as at December 31, 2008. Fair values
for derivative interest rate instruments accounted for as cash
fl ow hedges were then re-evaluated based on the hypothetical
market interest rates with the resulting effects on net income
and equity included in the sensitivity analysis. The fair value
interest rate risk from private placements that are hedged with
fair value hedges was also taken into consideration. However,
the effect on the income statement from changes in the fair
values of hedged items and hedging instruments attributable
to interest rate changes was not material. Exclusions from this
analysis are as follows:
—
Some fi xed-rate fi nancial assets, such as commercial
paper and certifi cates of deposit, which our Group values
at “fair value through profi t or loss” due to the short-term
maturity of these instruments. Potential effects due to changes
in interest rates are considered immaterial and are not recog-
nised in the sensitivity analysis.
—
Other fi xed-rate fi nancial instruments are measured at
amortised cost. Since a change in interest rates would not
change the carrying amount of this category of instruments,
there is no net income impact and they are excluded from this
analysis.
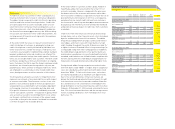
The interest rate sensitivity analysis assumes a parallel shift
of the interest yield curve for all currencies and was performed
on the same basis for both 2007 and 2008. A 100 basis
point increase in interest rates at December 31, 2008 would
have increased shareholders’ equity by € 4 million (2007:
€ 6 million) and decreased net income by € 1 million (2007:
€ 2 million). A 100 basis point decrease of the interest rates
at December 31, 2008 would have resulted in a € 5 million
decrease in shareholders’ equity (2007: € 7 million) and a
€ 1 million increase in net income (2007: € 2 million).
We believe the IFRS 7 interest rate analysis represents a realis-
tic if rough estimate of our current interest rate risk.
To moderate interest rate risks and maintain fi nancial fl ex-
ibility, a core tenet of our Group’s fi nancial strategy is to reduce
fi nancial leverage (i.e. net debt /shareholders’ equity) to under
50%. In light of the recent interest rates decrease in North
America and Europe, and given the expected economic situa-
tion worldwide, we are expecting interest rates in 2009 to be
stable or down from 2008. Therefore, we continue to project the
likelihood of signifi cant Group interest rate increases, which
could have a low fi nancial effect, as low.