Reebok 2008 Annual Report Download - page 62
Download and view the complete annual report
Please find page 62 of the 2008 Reebok annual report below. You can navigate through the pages in the report by either clicking on the pages listed below, or by using the keyword search tool below to find specific information within the annual report.-
 1
1 -
2
-
3
-
4
-
5
-
6
-
7
-
8
-
9
-
10
-
11
-
12
-
13
-
14
-
15
-
16
-
17
-
18
-
19
-
20
-
21
-
22
-
23
-
24
-
25
-
26
-
27
-
28
-
29
-
30
-
31
-
32
-
33
-
34
-
35
-
36
-
37
-
38
-
39
-
40
-
41
-
42
-
43
-
44
-
45
-
46
-
47
-
48
-
49
-
50
-
51
-
 52
52 -
 53
53 -
 54
54 -
 55
55 -
 56
56 -
 57
57 -
 58
58 -
 59
59 -
 60
60 -
 61
61 -
 62
62 -
 63
63 -
 64
64 -
 65
65 -
 66
66 -
 67
67 -
 68
68 -
 69
69 -
 70
70 -
 71
71 -
 72
72 -
73
-
74
-
75
-
76
-
77
-
78
-
79
-
80
-
81
-
82
-
83
-
84
-
85
-
86
-
87
-
88
-
89
-
90
-
91
-
92
-
93
-
94
-
95
-
96
-
97
-
98
-
99
-
100
-
101
-
102
-
103
-
104
-
105
-
106
-
107
-
108
-
109
-
110
-
111
-
112
-
113
-
114
-
115
-
116
-
117
-
118
-
119
-
120
-
121
-
122
-
123
-
124
-
125
-
126
-
127
-
128
-
129
-
130
-
131
-
132
-
133
-
134
-
135
-
136
-
137
-
138
-
139
-
140
-
141
-
142
-
143
-
144
-
145
-
146
-
147
-
148
-
149
-
150
-
151
-
152
-
153
-
154
-
155
-
156
-
157
-
158
-
159
-
160
-
161
-
162
-
163
-
164
-
165
-
166
-
167
-
168
-
169
-
170
-
171
-
172
-
173
-
174
-
175
-
176
-
177
-
178
-
179
-
180
-
181
-
182
-
183
-
184
-
185
-
186
-
187
-
188
-
189
-
190
-
191
-
192
-
193
-
194
-
195
-
196
-
197
-
198
-
199
-
200
-
201
-
202
-
203
-
204
-
205
-
206
-
207
-
208
-
209
-
210
-
211
-
212
-
213
-
214
-
215
-
216
-
217
-
218
-
219
-
220
 |
 |

058 Group Management Report – Our Group Structure and Strategy — Internal Group Management System
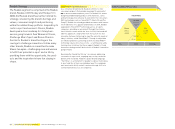
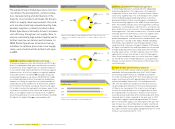
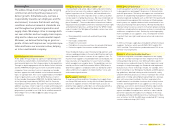
Free cash fl ow components
1) Excluding acquisitions and fi nance leases.
Internal Group Management System
The adidas Group’s central planning and con-
trolling system is designed to continually
increase the value of our Group and brands to
maximise shareholder value. By improving
our top- and bottom-line performance and
optimising the use of invested capital, we aim to
maximise free cash fl ow generation. This is our
principal goal for increasing shareholder
value.
Management utilises a variety of decision-
making tools to assess our current perfor-
mance and to align future strategic and
investment decisions to best utilise com
mer-
cial and organisational opportunities.
Free cash fl ow as Internal Group Management focus
The cornerstone of our Group’s Internal Management System
is our focus on free cash fl ow generation, which we believe is
the most important driver to sustain and increase shareholder
value. Free cash fl ow is comprised of operating components
(operating profi t, change in operating working capital and
capital expenditure) as well as non-operating components such
as fi nancial expenses and taxes. To maximise free cash fl ow
generation across our multi-brand organisation, brand man-
agement has direct responsibility for improving operating profi t
as well as optimising operating working capital and capital
expenditure. Non-operating items such as fi nancial expenses
and taxes are managed centrally by the Group Treasury and
Taxes departments. To keep Group and brand management
focused on long-term performance improvements, a portion
of the responsible managers’ total compensation is variable
and linked to a combination of operating profi t, operating
working capital development, Group earnings before taxes, or
relative /absolute stock price performance.
Operating margin as key performance indicator
of operational progress
Operating margin (defi ned as operating profi t as a percent-
age of net sales) is our Group’s most important measure of
operational success. It highlights the quality of our top line and
operational effi ciency.
Operating profi t
Operating working capital
Capital expenditure 1)
Non-operating components
Free
cash fl ow