Reebok 2008 Annual Report Download - page 208
Download and view the complete annual report
Please find page 208 of the 2008 Reebok annual report below. You can navigate through the pages in the report by either clicking on the pages listed below, or by using the keyword search tool below to find specific information within the annual report.-
 1
1 -
2
-
3
-
4
-
5
-
6
-
7
-
8
-
9
-
10
-
11
-
12
-
13
-
14
-
15
-
16
-
17
-
18
-
19
-
20
-
21
-
22
-
23
-
24
-
25
-
26
-
27
-
28
-
29
-
30
-
31
-
32
-
33
-
34
-
35
-
36
-
37
-
38
-
39
-
40
-
41
-
42
-
43
-
44
-
45
-
46
-
47
-
48
-
49
-
50
-
51
-
52
-
53
-
54
-
55
-
56
-
57
-
58
-
59
-
60
-
61
-
62
-
63
-
64
-
65
-
66
-
67
-
68
-
69
-
70
-
71
-
72
-
73
-
74
-
75
-
76
-
77
-
78
-
79
-
80
-
81
-
82
-
83
-
84
-
85
-
86
-
87
-
88
-
89
-
90
-
91
-
92
-
93
-
94
-
95
-
96
-
97
-
98
-
99
-
100
-
101
-
102
-
103
-
104
-
105
-
106
-
107
-
108
-
109
-
110
-
111
-
112
-
113
-
114
-
115
-
116
-
117
-
118
-
119
-
120
-
121
-
122
-
123
-
124
-
125
-
126
-
127
-
128
-
129
-
130
-
131
-
132
-
133
-
134
-
135
-
136
-
137
-
138
-
139
-
140
-
141
-
142
-
143
-
144
-
145
-
146
-
147
-
148
-
149
-
150
-
151
-
152
-
153
-
154
-
155
-
156
-
157
-
158
-
159
-
160
-
161
-
162
-
163
-
164
-
165
-
166
-
167
-
168
-
169
-
170
-
171
-
172
-
173
-
174
-
175
-
176
-
177
-
178
-
179
-
180
-
181
-
182
-
183
-
184
-
185
-
186
-
187
-
188
-
189
-
190
-
191
-
192
-
193
-
194
-
195
-
196
-
197
-
 198
198 -
 199
199 -
 200
200 -
 201
201 -
 202
202 -
 203
203 -
 204
204 -
 205
205 -
 206
206 -
 207
207 -
 208
208 -
 209
209 -
 210
210 -
 211
211 -
 212
212 -
 213
213 -
 214
214 -
 215
215 -
 216
216 -
 217
217 -
 218
218 -
219
-
220
 |
 |
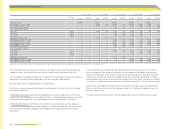
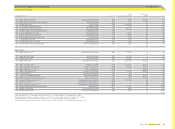
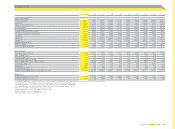
204 Consolidated Financial Statements Segmental information: ten-year overview
adidas Group segmental information: ten-year overview
€ in millions
2008 2007 2006 2005 2004 2003 2002 2001 2000 1999
Brands
adidas
Net sales 7,821 7,113 6,626 5,861 5,174 4,950 5,105 4,825 4,672 4,427
Gross profi t 3,802 3,370 3,059 2,654 2,284 2,008 2,004 1,845 1,907 1,827
Gross margin 48.6% 47.4% 46.2% 45.3% 44.1% 40.6% 39.2% 38.2% 40.8% 41.1%
Operating profi t 1) 1,098 920 788 693 564 365 343 352 391 431
Operating margin 1) 14.0% 12.9% 11.9% 11.8% 10.9% 7.4% 6.7% 7.3% 8.3% 9.6%
Operating assets 3,872 3,329 3,211 2,536 2,089 2,172 2,294 1,954 2,286 1,987
Reebok 2)
Net sales 2,148 2,333 2,473 — — — — — — —
Gross profi t 795 902 865 — — — — — — —
Gross margin 37.0% 38.7% 35.0% — — — — — — —
Operating profi t (7) 109 86 — — — — — — —
Operating margin (0.3%) 4.7% 3.5% ———————
Operating assets 3,033 2,913 3,217 — — — — — — —
TaylorMade-adidas Golf 3)
Net sales 812 804 856 709 633 637 707 545 441 327
Gross profi t 359 360 376 312 298 290 345 281 221 160
Gross margin 44.3% 44.7% 43.9% 44.0% 47.0% 45.5% 48.8% 51.5% 49.5% 48.4%
Operating profi t 1) 78 65 73 50 48 67 74 63 44 30
Operating margin 1) 9.6% 8.1% 8.5% 7.1% 7.5% 10.6% 10.5% 11.5% 10.0% 9.2%
Operating assets 748 629 656 692 619 391 433 316 219 156
1) Figures prior to 2004 exclude royalty and commission income and goodwill amortisation.
2) Consolidated in adidas Group from February 1, 2006 onwards.
3) Including Greg Norman apparel business from February 1, 2006 to November 30, 2006.
4) 2004 and 2005 refl ect continuing operations as a result of the divestiture of the Salomon business segment.
5) Including Reebok business segment from February 1, 2006 onwards. Including Greg Norman apparel business from February 1, 2006 to November 30, 2006.