Reebok 2008 Annual Report Download - page 116
Download and view the complete annual report
Please find page 116 of the 2008 Reebok annual report below. You can navigate through the pages in the report by either clicking on the pages listed below, or by using the keyword search tool below to find specific information within the annual report.-
 1
1 -
2
-
3
-
4
-
5
-
6
-
7
-
8
-
9
-
10
-
11
-
12
-
13
-
14
-
15
-
16
-
17
-
18
-
19
-
20
-
21
-
22
-
23
-
24
-
25
-
26
-
27
-
28
-
29
-
30
-
31
-
32
-
33
-
34
-
35
-
36
-
37
-
38
-
39
-
40
-
41
-
42
-
43
-
44
-
45
-
46
-
47
-
48
-
49
-
50
-
51
-
52
-
53
-
54
-
55
-
56
-
57
-
58
-
59
-
60
-
61
-
62
-
63
-
64
-
65
-
66
-
67
-
68
-
69
-
70
-
71
-
72
-
73
-
74
-
75
-
76
-
77
-
78
-
79
-
80
-
81
-
82
-
83
-
84
-
85
-
86
-
87
-
88
-
89
-
90
-
91
-
92
-
93
-
94
-
95
-
96
-
97
-
98
-
99
-
100
-
101
-
102
-
103
-
104
-
105
-
 106
106 -
 107
107 -
 108
108 -
 109
109 -
 110
110 -
 111
111 -
 112
112 -
 113
113 -
 114
114 -
 115
115 -
 116
116 -
 117
117 -
 118
118 -
 119
119 -
 120
120 -
 121
121 -
 122
122 -
 123
123 -
 124
124 -
 125
125 -
 126
126 -
127
-
128
-
129
-
130
-
131
-
132
-
133
-
134
-
135
-
136
-
137
-
138
-
139
-
140
-
141
-
142
-
143
-
144
-
145
-
146
-
147
-
148
-
149
-
150
-
151
-
152
-
153
-
154
-
155
-
156
-
157
-
158
-
159
-
160
-
161
-
162
-
163
-
164
-
165
-
166
-
167
-
168
-
169
-
170
-
171
-
172
-
173
-
174
-
175
-
176
-
177
-
178
-
179
-
180
-
181
-
182
-
183
-
184
-
185
-
186
-
187
-
188
-
189
-
190
-
191
-
192
-
193
-
194
-
195
-
196
-
197
-
198
-
199
-
200
-
201
-
202
-
203
-
204
-
205
-
206
-
207
-
208
-
209
-
210
-
211
-
212
-
213
-
214
-
215
-
216
-
217
-
218
-
219
-
220
 |
 |

112 Group Management Report – Our Financial Year Risk and Opportunity Report
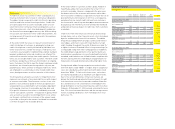
Risks from rising input costs
Raw material and labour costs account for approximately 70%
of the Group’s cost of sales. Prices of materials such as rub-
ber, and those which closely correlate with the oil price, are
especially subject to the risk of price changes. As our order-
ing process and price negotiations usually take place around
six months in advance of production, our sourcing function
has visibility and reaction time to manage and plan for sharp
increases in input costs.
To reduce the fi nancial impact on our product margins from
higher sourcing costs, we are implementing further lean
manufacturing techniques at our partner factories, eliminating
time and cost from the procurement process, re-engineering
our products where possible, and selectively increasing prices
if necessary see Global Operations, p. 064. In addition, in the
medium term we have the ability to adapt our sourcing struc-
ture to take advantage of more competitive pricing in other
locations.
During 2008, raw material price volatility, including record oil
prices, and the increase in labour costs in Asia negatively
impacted our sourcing terms negotiated for 2009 production.
As we begin planning for 2010, although raw material pricing
has eased for the time being, renewed increase in volatility
cannot be ruled out given the current macro economic uncer-
tainty. Therefore, we continue to assess the medium-term risks
from rising input costs as having a medium likelihood and a
medium potential fi nancial impact.
Supplier default risks
Over 95% of our product offering is sourced through indepen-
dent suppliers mainly located in Asia see Global Operations,
p. 064. To reduce the risk of business interruptions following a
potential supplier default, we work with vendors who demon-
strate reliability, quality, innovation and continuous improve-
ment. In addition, we have bought insurance coverage for the
risk of business interruptions caused by physical damage to
supplier premises. In 2008, the Group has again signifi cantly
reduced the number of independent manufacturers through
the further rationalisation of our supplier organisation see
Global Operations, p. 064. This exercise has allowed us to reduce
risk by simplifying our sourcing structure and focusing on the
highest-quality suppliers, without compromising our fl exibility
or competitiveness.
Therefore, we continue to assess supplier risks as having a low
likelihood of occurrence and potential fi nancial impact.
Product quality risks
The adidas Group faces a risk of selling defective products,
which may result in injury to consumers and /or image impair-
ment. We mitigate this risk through rigorous testing prior to
production, close cooperation with suppliers throughout the
manufacturing process, random testing after retail delivery,
open communication about defective products and quick
settlement of product liability claims when necessary. In
2008, we recalled 1,000 CCM Hockey and Reebok Hockey
helmets manufactured in Canada. The helmet’s chinstrap
could unexpectedly disengage while in use, posing a head
and neck injury risk to consumers when the helmet falls.
No injury was reported.
Our assessment of product quality risk remains unchanged
versus the prior year. We regard the likelihood of signifi cant
product liability cases or having to conduct wide-scale product
recalls as low. As we have insurance protecting us against the
fi nancial consequences of signifi cant product liability cases, we
also assess the fi nancial impact as low.
Customer risks
Customer risks arise from our dependence on key customers
who have the ability to exert bargaining power and can there-
fore cause considerable margin pressure or cancel orders.
These risks exist not only due to the relative size of some of our
major customers, but also as a result of our limited ability to
infl uence how they conduct business and the external impacts
of the consumer environment in which they operate.
To limit these risks, we utilise a broad distribution strategy
which includes expanding our controlled space activities. This
enables us to reduce negative consequences resulting from
sales shortfalls that can occur with key customers. Specifi -
cally, no customer at adidas, Reebok and TaylorMade-adidas
Golf accounted for more than 10% of brand sales in 2008.
When necessary, we restrict or limit the distribution of our
brands to protect brand image or product margins, and to
streamline supply. In 2008, we continued our retail segmenta-
tion strategy. By segmenting product offer to our customers,
we limit the risk of increased competition which can result
in higher sales discounts. For example, in the course of 2008,
the Group decided to limit the Reebok product offering to an
important mall-based key account in North America.
Due to the challenging economic situation and diffi culties at
some major sporting goods retailers in developed markets,
we continue to view the risk of a strong reduction of business
with one of our brands’ biggest retailers as having a medium
likelihood of occurrence. Such an event could have a medium
fi nancial impact on the sales and profi tability of a particular
region. On a Group level, given the deterioration in several
markets compared to the prior year, we now view the fi nancial
impact from customer risks as medium.