Reebok 2008 Annual Report Download - page 84
Download and view the complete annual report
Please find page 84 of the 2008 Reebok annual report below. You can navigate through the pages in the report by either clicking on the pages listed below, or by using the keyword search tool below to find specific information within the annual report.-
 1
1 -
2
-
3
-
4
-
5
-
6
-
7
-
8
-
9
-
10
-
11
-
12
-
13
-
14
-
15
-
16
-
17
-
18
-
19
-
20
-
21
-
22
-
23
-
24
-
25
-
26
-
27
-
28
-
29
-
30
-
31
-
32
-
33
-
34
-
35
-
36
-
37
-
38
-
39
-
40
-
41
-
42
-
43
-
44
-
45
-
46
-
47
-
48
-
49
-
50
-
51
-
52
-
53
-
54
-
55
-
56
-
57
-
58
-
59
-
60
-
61
-
62
-
63
-
64
-
65
-
66
-
67
-
68
-
69
-
70
-
71
-
72
-
73
-
 74
74 -
 75
75 -
 76
76 -
 77
77 -
 78
78 -
 79
79 -
 80
80 -
 81
81 -
 82
82 -
 83
83 -
 84
84 -
 85
85 -
 86
86 -
 87
87 -
 88
88 -
 89
89 -
 90
90 -
 91
91 -
 92
92 -
 93
93 -
 94
94 -
95
-
96
-
97
-
98
-
99
-
100
-
101
-
102
-
103
-
104
-
105
-
106
-
107
-
108
-
109
-
110
-
111
-
112
-
113
-
114
-
115
-
116
-
117
-
118
-
119
-
120
-
121
-
122
-
123
-
124
-
125
-
126
-
127
-
128
-
129
-
130
-
131
-
132
-
133
-
134
-
135
-
136
-
137
-
138
-
139
-
140
-
141
-
142
-
143
-
144
-
145
-
146
-
147
-
148
-
149
-
150
-
151
-
152
-
153
-
154
-
155
-
156
-
157
-
158
-
159
-
160
-
161
-
162
-
163
-
164
-
165
-
166
-
167
-
168
-
169
-
170
-
171
-
172
-
173
-
174
-
175
-
176
-
177
-
178
-
179
-
180
-
181
-
182
-
183
-
184
-
185
-
186
-
187
-
188
-
189
-
190
-
191
-
192
-
193
-
194
-
195
-
196
-
197
-
198
-
199
-
200
-
201
-
202
-
203
-
204
-
205
-
206
-
207
-
208
-
209
-
210
-
211
-
212
-
213
-
214
-
215
-
216
-
217
-
218
-
219
-
220
 |
 |
080 Group Management Report – Our Financial Year Group Business Performance — Economic and Sector Development
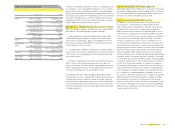
Quarterly development of Consumer Price Index 1)
by region
Q4 2007 Q1 2008 Q2 2008 Q3 2008 Q4 2008
USA 4.1 4.0 5.0 4.9 0.1
Euro Zone 3.1 3.6 4.0 3.6 1.6
Japan 0.7 1.2 2.0 2.1 0.4
1) Source: Bloomberg.
Quarterly unemployment rate by region
in % of total active population
Q4 2007 Q1 2008 Q2 2008 Q3 2008 Q4 2008
USA 1) 4.9 5.1 5.6 6.2 7.2
Euro Zone 2) 7.2 7.2 7.4 7.6 8.0
Japan 3) 3.8 3.8 4.1 4.0 4.4
1) Source: US Bureau of Labor Statistics.
2) Source: Eurostat.
3) Source: Japan Ministry of Internal Affairs and Communications.
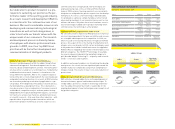
Group Business Performance
In 2008, the adidas Group again delivered
strong fi nancial performance. Group sales and
profi tability developed in line with Manage-
ment’s initial expectations. Currency-neutral
sales increased 9%. Double-digit sales growth
in the adidas segment had the biggest impact
on this development. In euro terms, adidas
Group revenues grew 5% to € 10.799 billion in
2008 from € 10.299 billion in 2007. The Group’s
gross margin increased 1.3 percentage points
to 48.7% in 2008 (2007: 47.4%) mainly driven by
an improving regional mix, further own-retail
expansion and a more favourable product mix.
The Group’s gross profi t increased 8% to reach
€ 5.256 billion in 2008 versus € 4.882 billion
in 2007. The Group’s operating margin grew
0.7 percentage points to 9.9% from 9.2% in
2007, due to the higher gross margin which
more than offset higher net other operating
expenses and income as a percentage of sales.
The Group’s operating profi t increased 13% to
€ 1.070 billion in 2008 versus € 949 million in
2007. The Group’s net income attributable to
shareholders grew 16% to € 642 million from
€ 551 million in 2007. Diluted earnings per
share increased 20% to € 3.07 in 2008 versus
€ 2.57 in 2007.
Economic and Sector Development
Global economic growth at its lowest level in six years
In 2008, the global economy grew 2.0%. This represents a
sharp slowdown versus the 2007 growth rate of 4.0%. The
crisis that started in 2007 in the banking sector spilled over into
the real economy, with each region seeing a slow moderation
in GDP growth. The crisis intensifi ed from October onwards,
with all key economic indicators spiralling downwards.
In Europe, full year GDP increased by 0.9% (2007: 2.8%). A
moderation of growth in Western Europe was only partly offset
by the region’s emerging markets. The latter grew their econ-
omy by 4.6%, but also showed signs of a slowdown. Despite a
slight improvement mid-year, consumer confi dence in Europe
declined throughout 2008. As a result of the crisis, unemploy-
ment rose to its highest level since February 2007.
In the USA, economic growth decreased to 1.3% in 2008 (2007:
2.0%). Depression of the housing market and a troubled bank-
ing sector suffering from the liquidity crisis drove this develop-
ment. As a result of the economic diffi culties, the unemploy-
ment rate rose to a 16-year high of 7.2% in December, and
brought US consumer confi dence to an all-time low.
In Asia, most of the region’s economies continued on a strong
upswing, albeit at a lower rate than in previous years. Asia’s
GDP grew 4.2% in 2008 (2007: 6.9%). GDP growth in China was
9.0%, while Japan’s economy shrank 0.2%. Developing Asian
countries indirectly suffered from the crisis, experiencing a
decline in exports and foreign investment. Consumer confi -
dence in Asia decreased in most countries, including Japan
and China.
Despite slightly slower activity, GDP growth in Latin America
reached 4.2% in 2008 (2007: 5.5%). Economic growth lost
momentum in the last months of the year due to a decline in
commodity prices and lower exports. Consumer confi dence in
the region declined in 2008, especially towards the end of the
year.
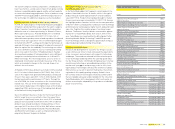
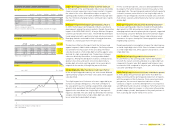
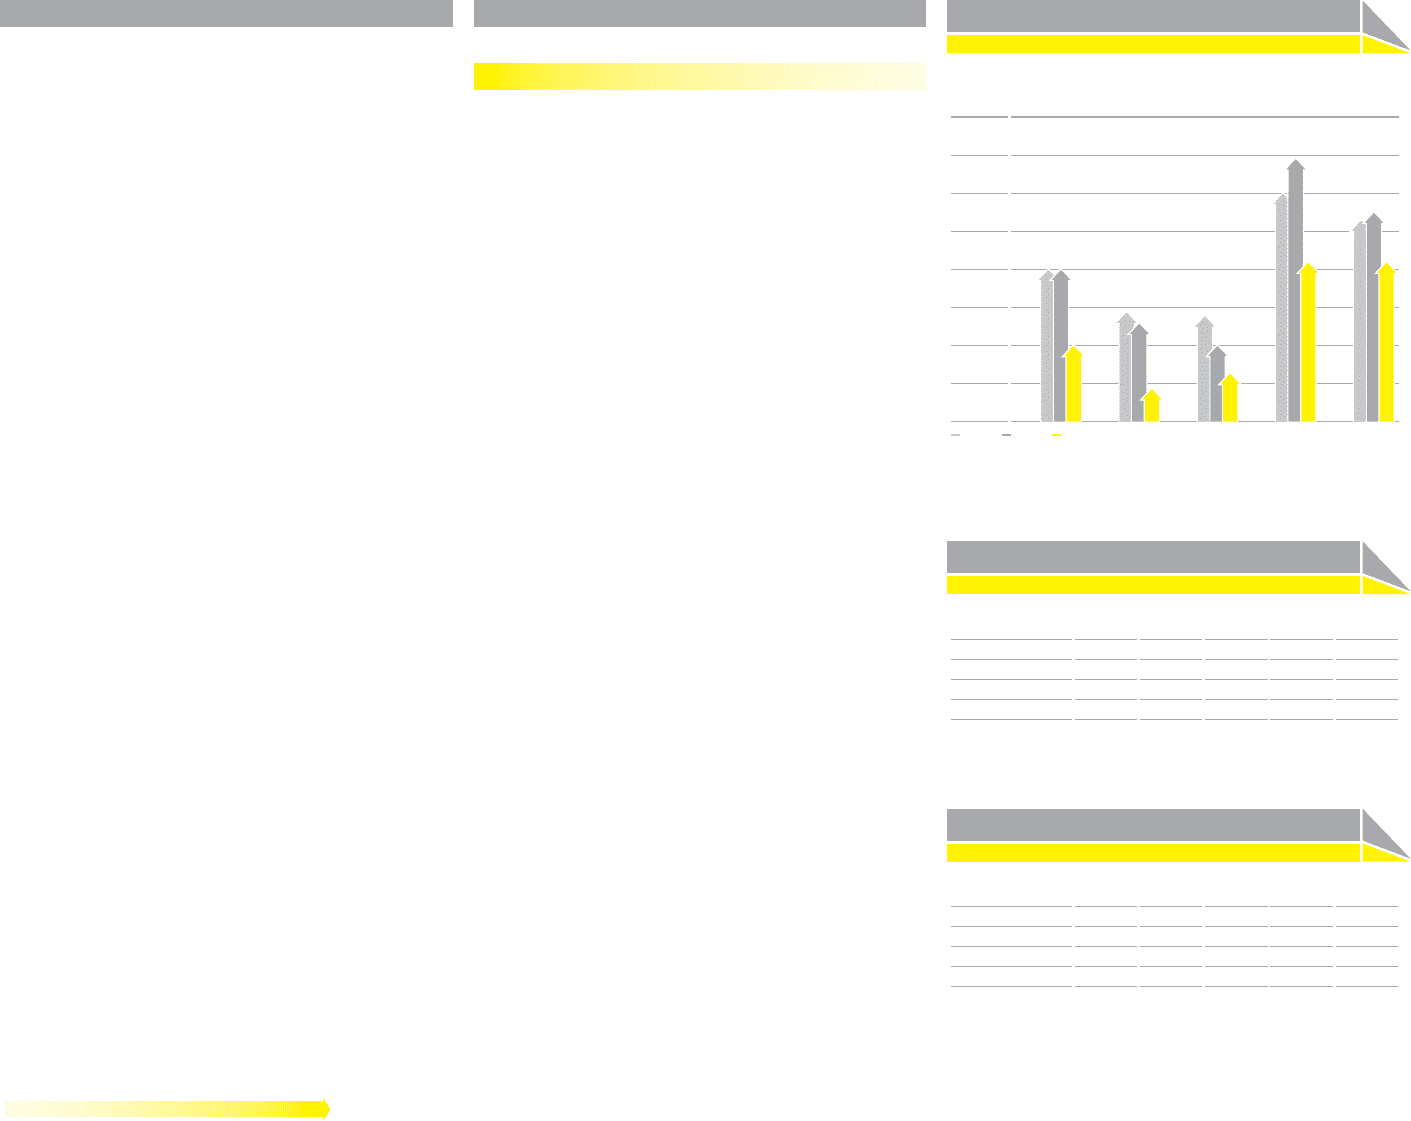
Regional GDP development 1)
in %
Global Europe USA Asia 2)
Latin
America
6
4
2
0
2006 2007 2008
1) Real, percentage change versus prior year; 2008 fi gures are estimated.
2) Asia also includes Japan and Area Pacifi c.
Source: Goldman Sachs.