Reebok 2008 Annual Report Download - page 80
Download and view the complete annual report
Please find page 80 of the 2008 Reebok annual report below. You can navigate through the pages in the report by either clicking on the pages listed below, or by using the keyword search tool below to find specific information within the annual report.-
 1
1 -
2
-
3
-
4
-
5
-
6
-
7
-
8
-
9
-
10
-
11
-
12
-
13
-
14
-
15
-
16
-
17
-
18
-
19
-
20
-
21
-
22
-
23
-
24
-
25
-
26
-
27
-
28
-
29
-
30
-
31
-
32
-
33
-
34
-
35
-
36
-
37
-
38
-
39
-
40
-
41
-
42
-
43
-
44
-
45
-
46
-
47
-
48
-
49
-
50
-
51
-
52
-
53
-
54
-
55
-
56
-
57
-
58
-
59
-
60
-
61
-
62
-
63
-
64
-
65
-
66
-
67
-
68
-
69
-
 70
70 -
 71
71 -
 72
72 -
 73
73 -
 74
74 -
 75
75 -
 76
76 -
 77
77 -
 78
78 -
 79
79 -
 80
80 -
 81
81 -
 82
82 -
 83
83 -
 84
84 -
 85
85 -
 86
86 -
 87
87 -
 88
88 -
 89
89 -
 90
90 -
91
-
92
-
93
-
94
-
95
-
96
-
97
-
98
-
99
-
100
-
101
-
102
-
103
-
104
-
105
-
106
-
107
-
108
-
109
-
110
-
111
-
112
-
113
-
114
-
115
-
116
-
117
-
118
-
119
-
120
-
121
-
122
-
123
-
124
-
125
-
126
-
127
-
128
-
129
-
130
-
131
-
132
-
133
-
134
-
135
-
136
-
137
-
138
-
139
-
140
-
141
-
142
-
143
-
144
-
145
-
146
-
147
-
148
-
149
-
150
-
151
-
152
-
153
-
154
-
155
-
156
-
157
-
158
-
159
-
160
-
161
-
162
-
163
-
164
-
165
-
166
-
167
-
168
-
169
-
170
-
171
-
172
-
173
-
174
-
175
-
176
-
177
-
178
-
179
-
180
-
181
-
182
-
183
-
184
-
185
-
186
-
187
-
188
-
189
-
190
-
191
-
192
-
193
-
194
-
195
-
196
-
197
-
198
-
199
-
200
-
201
-
202
-
203
-
204
-
205
-
206
-
207
-
208
-
209
-
210
-
211
-
212
-
213
-
214
-
215
-
216
-
217
-
218
-
219
-
220
 |
 |

076 Group Management Report – Our Group Corporate Functions — Research and Development
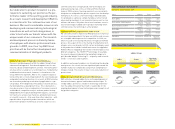
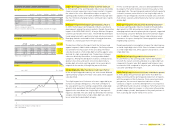
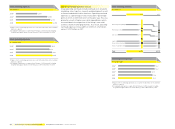
R & D expenses
€ in millions
2004 1) 59
2005 1) 63
2006 2) 98
2007 84
2008 81
1) Figures refl ect continuing operations as a result of the divestiture of the Salomon
business segment.
2) Including Reebok business segment from February 1, 2006 onwards. Including
Greg Norman apparel business from February 1, 2006 to November 30, 2006.
R & D expenses
in % of net sales
2004 1) 1.0
2005 1) 0.9
2006 2) 1.0
2007 0.8
2008 0.8
1) Figures refl ect continuing operations as a result of the divestiture of the Salomon
business segment.
2) Including Reebok business segment from February 1, 2006 onwards. Including
Greg Norman apparel business from February 1, 2006 to November 30, 2006.
R & D expenses
in % of operating expenses
2004 1) 2.6
2005 1) 2.5
2006 2) 2.6
2007 2.1
2008 1.9
1) Figures refl ect continuing operations as a result of the divestiture of the Salomon
business segment.
2) Including Reebok business segment from February 1, 2006 onwards. Including
Greg Norman apparel business from February 1, 2006 to November 30, 2006.
Active trademark and patent protection policy
To capitalise on the Group’s R&D achievements, we seek
patent protection for all our footwear, apparel and hardware
innovations. It is an important business policy for our Group
to secure the best available patent protection for our innova-
tions in major markets. As we use a wide range of different
technologies in our products, we are not dependent upon any
single tech nology, or any patent rights related to any single
tech nology. We also own a substantial portfolio of registered
trademarks for the Group’s brands and related proprietary
names. As part of our business policy, we vigorously enforce
the Group’s trademarks and patents by monitoring the mar-
kets for infringements and taking action to prevent them. This
includes a vigorous anti-counterfeiting programme. We also
have stringent processes, and undertake signifi cant research,
to avoid infringement of third-party intellectual property rights
see Risk and Opportunity Report, p. 107.
Effi ciency improvements reduce R&D expenses
In 2008, all research and development costs were expensed
as incurred. adidas Group R&D expenses decreased by 3%
to € 81 million (2007: € 84 million) as a result of continued
effi ciency improvements at all brands. R&D expenses include
expenses for personnel and administration, but exclude other
costs, for example those associated with the design aspect
of the product creation process. Personnel expenses rep-
resent the largest portion of R&D expenses, accounting for
more than 50% of total R&D expenses in 2008. In 2008, R&D
expenses represented 1.9% of total operating expenses versus
2.1% in the prior year. R&D expenses as a percentage of sales
remained stable at 0.8% (2007: 0.8%) see Note 2, p. 158.
Highly skilled technical personnel
For all our brands, the success of our R&D efforts depends on
bringing together a diverse and highly skilled workforce. At
December 31, 2008, 1,152 people were employed in the Group’s
R&D activities compared to 976 employees in 2007 (+18%).
This represents 3% of total Group employees, unchanged
compared to the prior year (2007: 3%).
The R&D departments for each brand comprise experienced
teams from different areas of expertise. Employees with a
background in mechanical engineering and biomechanics spe-
cialise primarily in the development of performance footwear
with a special focus on reducing stress on knees and other
joints. Experts in material
engineering concentrate on the
development of apparel and footwear with an emphasis on
reducing skin irritation, increasing durability and fl exibility
as well as enhancing
temperature and moisture management.
Other professional backgrounds include industrial design,
Finite Element Analysis, advanced CAD design and product
development.
Successful commercialisation of technological innovations
Developing industry-leading technologies is only one aspect
of being an innovation leader. Even more important is the
successful commercialisation of those technological innova-
tions. The majority of adidas Group sales in 2008 were gener-
ated with products newly introduced in the course of the year.
As new products tend to have a higher gross margin compared
to products which are in the market for more than one season,
newly launched products contributed overproportionately to
the Group’s net income development in 2008. We expect this
development to continue in 2009 as our launch schedule high-
lights a full pipeline of innovative products see Subsequent
Events and Outlook, p. 120.
Successful product launches across all
major adidas categories
The strong sales development of brand adidas in 2008 was
largely based on launching evolutions of existing technologies
in all major categories. Products launched in 2008 accounted
for 78% of brand sales (2007: 77%). Only 5% of total sales were
generated with products introduced three or more years ago
(2007: 6%).
Highlight product launches in the football category included
the EUROPASS, the offi cial ball for the UEFA EURO 2008™, of
which we sold more than six million pieces in 2008. Its revo-
lutionary PSC-Texture™ guarantees optimum grip between
ball and boot in all weather conditions. adidas also launched
miCoach, an interactive training system which collects and
turns personal data into individual training plans based on the
user’s fi tness level and specifi c goals.