Reebok 2008 Annual Report Download - page 163
Download and view the complete annual report
Please find page 163 of the 2008 Reebok annual report below. You can navigate through the pages in the report by either clicking on the pages listed below, or by using the keyword search tool below to find specific information within the annual report.-
 1
1 -
2
-
3
-
4
-
5
-
6
-
7
-
8
-
9
-
10
-
11
-
12
-
13
-
14
-
15
-
16
-
17
-
18
-
19
-
20
-
21
-
22
-
23
-
24
-
25
-
26
-
27
-
28
-
29
-
30
-
31
-
32
-
33
-
34
-
35
-
36
-
37
-
38
-
39
-
40
-
41
-
42
-
43
-
44
-
45
-
46
-
47
-
48
-
49
-
50
-
51
-
52
-
53
-
54
-
55
-
56
-
57
-
58
-
59
-
60
-
61
-
62
-
63
-
64
-
65
-
66
-
67
-
68
-
69
-
70
-
71
-
72
-
73
-
74
-
75
-
76
-
77
-
78
-
79
-
80
-
81
-
82
-
83
-
84
-
85
-
86
-
87
-
88
-
89
-
90
-
91
-
92
-
93
-
94
-
95
-
96
-
97
-
98
-
99
-
100
-
101
-
102
-
103
-
104
-
105
-
106
-
107
-
108
-
109
-
110
-
111
-
112
-
113
-
114
-
115
-
116
-
117
-
118
-
119
-
120
-
121
-
122
-
123
-
124
-
125
-
126
-
127
-
128
-
129
-
130
-
131
-
132
-
133
-
134
-
135
-
136
-
137
-
138
-
139
-
140
-
141
-
142
-
143
-
144
-
145
-
146
-
147
-
148
-
149
-
150
-
151
-
152
-
 153
153 -
 154
154 -
 155
155 -
 156
156 -
 157
157 -
 158
158 -
 159
159 -
 160
160 -
 161
161 -
 162
162 -
 163
163 -
 164
164 -
 165
165 -
 166
166 -
 167
167 -
 168
168 -
 169
169 -
 170
170 -
 171
171 -
 172
172 -
 173
173 -
174
-
175
-
176
-
177
-
178
-
179
-
180
-
181
-
182
-
183
-
184
-
185
-
186
-
187
-
188
-
189
-
190
-
191
-
192
-
193
-
194
-
195
-
196
-
197
-
198
-
199
-
200
-
201
-
202
-
203
-
204
-
205
-
206
-
207
-
208
-
209
-
210
-
211
-
212
-
213
-
214
-
215
-
216
-
217
-
218
-
219
-
220
 |
 |

adidas Group Annual Report 2008 159
Changes in the fair value of derivatives that are designated and qualify as cash fl ow hedges, and
that are effective, as defi ned in IAS 39, are recognised in equity. When the effectiveness is not
100%, the ineffective portion of the fair value is recognised in net income. Cumulated gains and
losses in equity are transferred to the income statement in the same periods during which the
hedged forecasted transaction affects the income statement.
For derivative instruments designated as fair value hedges, the gains or losses on the deriv-
atives and the offsetting gains or losses on the hedged items are recognised immediately in net
income.
Certain derivative transactions, while providing effective economic hedges under the Group’s risk
management policies, may not qualify for hedge accounting under the specifi c rules of IAS 39.
Changes in the fair value of any derivative instruments that do not qualify for hedge accounting
under IAS 39 are recognised immediately in the income statement.
Hedges of net investments in foreign entities are accounted for in a similar way to cash fl ow
hedges. If, for example, the hedging instrument is a derivative (e.g. a forward contract) or, for
example, a foreign currency borrowing, effective currency gains and losses in the derivative and
all gains and losses arising on the translation of the borrowing, respectively, are recognised in
equity.
The Group documents the relationship between hedging instruments and hedged items at
transaction inception, as well as the risk management objectives and strategies for undertaking
various hedge transactions. This process includes linking all derivatives designated as hedges
to specifi c fi rm commitments and forecasted transactions. The Group also documents its
assessment of whether the deriv atives that are used in hedging transactions are highly effec-
tive by using different methods of effectiveness testing, such as the “dollar offset method” or
the “ hypothetical derivative method”.
The fair values of forward contracts and currency options are determined on the basis of market
conditions on the reporting dates. The fair value of a currency option is determined using gener-
ally accepted models to calculate option prices. The fair market value of an option is infl uenced
not only by the remaining term of the option but also by additional factors, such as the actual
foreign exchange rate and the volatility of the underlying foreign currency base. The fair values of
interest rate options on the reporting date are assessed by generally accepted models, such as
the “Markov functional model”.
Cash and cash equivalents
Cash and cash equivalents represent cash and short-term bank deposits with maturities of three
months or less from the date of acquisition.
Receivables and other assets
Receivables and other assets are recognised at fair value, which is estimated as the present
value of future cash fl ows discounted at the market rate of interest at the balance sheet date. If
necessary, required allowances are determined on the basis of individual risk assessment and
past experience of losses.
Inventories
Merchandise and fi nished goods are valued at the lower of cost or net realisable value, which
is the estimated selling price in the ordinary course of business less the estimated costs of
completion and the estimated costs necessary to make the sale. Costs are determined using a
standard valuation method: the “average cost method”. Costs of fi nished goods include cost of
raw materials, direct labour and the components of the manufacturing overheads which can rea-
sonably be attributed. The net realisable value allowances are computed consistently throughout
the Group based on the age and expected future sales of the items on hand.
Assets /liabilities classifi ed as held-for-sale
Assets and liabilities (primarily non-current) that are expected to be recovered principally
through sale rather than through continuing use are classifi ed as held-for-sale. These are
measured at the lower of their carrying amount and fair value less cost to sell.
Property, plant and equipment
Property, plant and equipment are stated at cost (which comprises any costs directly attributable
to bringing the asset to the condition necessary for it to be capable of operating in the manner
intended by Management) less accumulated depreciation (except for land and construction in
progress) and accumulated impairment losses. Depreciation is computed utilising the “straight-
line method”, except where the “declining-balance method” is more appropriate in light of the
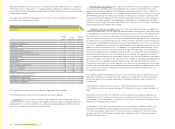
actual utilisation pattern. Useful lives are as follows:
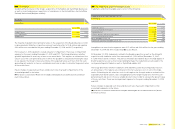
Useful lives of property, plant and equipment
Years
Buildings /Leasehold improvements 5 – 50
Technical equipment and machinery as well as other equipment and furniture and fi ttings
2 – 10
Expenditures for repairs and maintenance are expensed as incurred. Renewals and improve-
ments are capitalised and depreciated separately, if the recognition criteria are met.