Reebok 2008 Annual Report Download - page 196
Download and view the complete annual report
Please find page 196 of the 2008 Reebok annual report below. You can navigate through the pages in the report by either clicking on the pages listed below, or by using the keyword search tool below to find specific information within the annual report.-
 1
1 -
2
-
3
-
4
-
5
-
6
-
7
-
8
-
9
-
10
-
11
-
12
-
13
-
14
-
15
-
16
-
17
-
18
-
19
-
20
-
21
-
22
-
23
-
24
-
25
-
26
-
27
-
28
-
29
-
30
-
31
-
32
-
33
-
34
-
35
-
36
-
37
-
38
-
39
-
40
-
41
-
42
-
43
-
44
-
45
-
46
-
47
-
48
-
49
-
50
-
51
-
52
-
53
-
54
-
55
-
56
-
57
-
58
-
59
-
60
-
61
-
62
-
63
-
64
-
65
-
66
-
67
-
68
-
69
-
70
-
71
-
72
-
73
-
74
-
75
-
76
-
77
-
78
-
79
-
80
-
81
-
82
-
83
-
84
-
85
-
86
-
87
-
88
-
89
-
90
-
91
-
92
-
93
-
94
-
95
-
96
-
97
-
98
-
99
-
100
-
101
-
102
-
103
-
104
-
105
-
106
-
107
-
108
-
109
-
110
-
111
-
112
-
113
-
114
-
115
-
116
-
117
-
118
-
119
-
120
-
121
-
122
-
123
-
124
-
125
-
126
-
127
-
128
-
129
-
130
-
131
-
132
-
133
-
134
-
135
-
136
-
137
-
138
-
139
-
140
-
141
-
142
-
143
-
144
-
145
-
146
-
147
-
148
-
149
-
150
-
151
-
152
-
153
-
154
-
155
-
156
-
157
-
158
-
159
-
160
-
161
-
162
-
163
-
164
-
165
-
166
-
167
-
168
-
169
-
170
-
171
-
172
-
173
-
174
-
175
-
176
-
177
-
178
-
179
-
180
-
181
-
182
-
183
-
184
-
185
-
 186
186 -
 187
187 -
 188
188 -
 189
189 -
 190
190 -
 191
191 -
 192
192 -
 193
193 -
 194
194 -
 195
195 -
 196
196 -
 197
197 -
 198
198 -
 199
199 -
 200
200 -
 201
201 -
 202
202 -
 203
203 -
 204
204 -
 205
205 -
 206
206 -
207
-
208
-
209
-
210
-
211
-
212
-
213
-
214
-
215
-
216
-
217
-
218
-
219
-
220
 |
 |

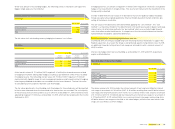
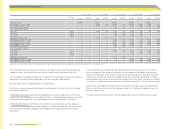
192 Consolidated Financial Statements Notes
Primary segmental information by brand
€ in millions
adidas Reebok TaylorMade-adidas Golf HQ /Consolidation adidas Group
2008 2007 2008 2007 2008 2007 2008 2007 2008 2007
Net sales to third parties 7,821 7,113 2,148 2,333 812 804 18 49 10,799 10,299
Gross profi t 3,802 3,370 795 902 359 360 300 250 5,256 4,882
in % of net sales 48.6% 47.4% 37.0% 38.7% 44.3% 44.7% — — 48.7% 47.4%
Operating profi t 1,098 920 (7) 109 78 65 (99) (145) 1,070 949
in % of net sales 14.0% 12.9% (0.3)% 4.7% 9.6% 8.1% — — 9.9% 9.2%
Assets 3,872 3,329 3,033 2,913 748 629 1,880 1,454 9,533 8,325
Liabilities 1,041 900 355 421 127 106 4,610 3,865 6,133 5,292
Capital expenditure 189 150 53 57 15 12 123 70 380 289
Capital expenditure from acquisitions of subsidiaries 27 — — — 59 — — — 86 —
Amortisation and depreciation 117 104 60 60 11 12 33 25 221 201
Impairment 5 2 1 1 — — — — 6 3
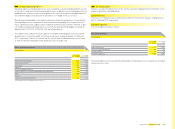
Secondary segmental information by region
€ in millions
Europe North America Asia Latin America HQ /Consolidation adidas Group
2008 2007 2008 2007 2008 2007 2008 2007 2008 2007 2008 2007
Net sales to third parties 4,665 4,369 2,520 2,929 2,662 2,254 893 657 59 89 10,799 10,299
Assets 2,319 1,819 1,659 1,489 962 772 547 285 4,046 3,960 9,533 8,325
Capital expenditure 102 105 45 34 61 49 29 10 143 91 380 289
Capital expenditure from
acquisitions of subsidiaries ——86———————86—
Region Europe also includes Middle East and Africa, Region Asia also includes the Pacifi c region.