Reebok 2008 Annual Report Download - page 68
Download and view the complete annual report
Please find page 68 of the 2008 Reebok annual report below. You can navigate through the pages in the report by either clicking on the pages listed below, or by using the keyword search tool below to find specific information within the annual report.-
 1
1 -
2
-
3
-
4
-
5
-
6
-
7
-
8
-
9
-
10
-
11
-
12
-
13
-
14
-
15
-
16
-
17
-
18
-
19
-
20
-
21
-
22
-
23
-
24
-
25
-
26
-
27
-
28
-
29
-
30
-
31
-
32
-
33
-
34
-
35
-
36
-
37
-
38
-
39
-
40
-
41
-
42
-
43
-
44
-
45
-
46
-
47
-
48
-
49
-
50
-
51
-
52
-
53
-
54
-
55
-
56
-
57
-
 58
58 -
 59
59 -
 60
60 -
 61
61 -
 62
62 -
 63
63 -
 64
64 -
 65
65 -
 66
66 -
 67
67 -
 68
68 -
 69
69 -
 70
70 -
 71
71 -
 72
72 -
 73
73 -
 74
74 -
 75
75 -
 76
76 -
 77
77 -
 78
78 -
79
-
80
-
81
-
82
-
83
-
84
-
85
-
86
-
87
-
88
-
89
-
90
-
91
-
92
-
93
-
94
-
95
-
96
-
97
-
98
-
99
-
100
-
101
-
102
-
103
-
104
-
105
-
106
-
107
-
108
-
109
-
110
-
111
-
112
-
113
-
114
-
115
-
116
-
117
-
118
-
119
-
120
-
121
-
122
-
123
-
124
-
125
-
126
-
127
-
128
-
129
-
130
-
131
-
132
-
133
-
134
-
135
-
136
-
137
-
138
-
139
-
140
-
141
-
142
-
143
-
144
-
145
-
146
-
147
-
148
-
149
-
150
-
151
-
152
-
153
-
154
-
155
-
156
-
157
-
158
-
159
-
160
-
161
-
162
-
163
-
164
-
165
-
166
-
167
-
168
-
169
-
170
-
171
-
172
-
173
-
174
-
175
-
176
-
177
-
178
-
179
-
180
-
181
-
182
-
183
-
184
-
185
-
186
-
187
-
188
-
189
-
190
-
191
-
192
-
193
-
194
-
195
-
196
-
197
-
198
-
199
-
200
-
201
-
202
-
203
-
204
-
205
-
206
-
207
-
208
-
209
-
210
-
211
-
212
-
213
-
214
-
215
-
216
-
217
-
218
-
219
-
220
 |
 |
064 Group Management Report – Our Group Corporate Functions — Global Operations
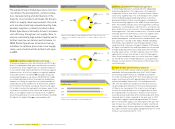
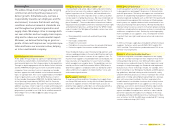
Suppliers by region 1)
1) Figures include adidas, Reebok and adidas Golf, but exclude local sourcing
partners, sourcing agents, subcontractors, second tier suppliers and licensee
factories.
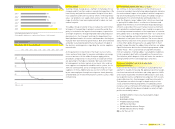
Footwear production by region 1)
1) Figures only include adidas, Reebok and adidas Golf.
Asia 74%
Asia 97%
Americas 13%
Americas 1%
Europe 13%
Europe 2%
Global Operations
The adidas Group’s Global Operations function
coordinates the development, commercialisa-
tion, manufacturing and distribution of the
majority of our products and leads the Group’s
efforts in supply chain improvement. Our prod-
ucts are almost entirely manufactured by inde-
pendent suppliers, primarily located in Asia.
Global Operations continually strives to increase
cost effi ciency throughout our supply chain, to
ensure consistently high product quality and to
further improve our delivery performance. In
2008, Global Operations focused on fi ve key
initiatives to optimise processes in our supply
chain, each of which will be further built upon
in 2009.
Independent partners producing most of our goods
To minimise production costs, we outsource over 95% of pro-
duction to independent third-party manufacturers, primarily
located in Asia. These suppliers possess excellent expertise
in cost-effi cient high-volume production of footwear, apparel
and accessories. A list of our suppliers is regularly updated
and can be found on our website www.adidas-Group.com /
en / sustainability/suppliers_ and_wor kers. We provide our suppli-
ers with detailed specifi cations for production and delivery.
However, our Group also operates a very limited number of
own production and assembly sites in Germany (1), Sweden
(1), Finland (1), the USA (4), Canada (4), China (1) and Japan
(1). In order to ensure the high quality consumers expect from
our products, we enforce strict control and inspection proce-
dures at our suppliers and in our own factories. In addition,
we promote adherence to social and environmental standards
throughout our supply chain see Sustainability, p. 067.
Continued consolidation of manufacturing partners
In 2008, Global Operations worked with 300 independent
manufacturing partners. This represents a 20% reduction
compared to the prior year and is a result of further rationali-
sation of our supplier base. This is mainly due to the comple-
tion of the Reebok apparel build programme, in which we
phased out Reebok’s former sourcing agents and replaced
them with existing suppliers in the adidas Group sourcing net-
work. This number excludes local sourcing partners of Group
subsidiaries, sourcing agents, subcontractors, second tier sup-
pliers and factories of our licensees. Of our independent manu-
facturing partners, 74% were located in Asia, 13% were located
in Europe and 13% in the Americas. 29% of all suppliers were
located in China. Our Global Operations function manages
product development, commercialisation and distribution, and
also supervises sourcing of the adidas, Reebok and adidas
Golf brands. Due to different sourcing requirements in their
respective fi elds of business, Rockport, Reebok-CCM Hockey,
the Sports Licensed Division and TaylorMade are not serviced
through Global Operations but instead utilise their own pur-
chasing organisations. In order to quickly seize short-term
opportunities in their local market or react to trade regula-
tions, Group subsidiaries may also source from local suppli-
ers outside the realm of Global Operations. Local purchases,
however, account only for a minor portion of the Group’s total
sourcing volume.
Decrease in China share of footwear production
97% of our total 2008 footwear volume for adidas, Reebok
and adidas Golf was produced in Asia (2007: 96%). Produc-
tion in Europe and the Americas combined accounted for
3% of the sourcing volume (2007: 4%). China represents our
largest sourcing country with approximately 44% of the total
volume, followed by Vietnam with 31% and Indonesia with
18%. The only signifi cant change versus the prior year was
a 5 percentage point reduction in the overall representation
of China in our sourcing mix. This is part of our strategy to
increase the regional diversity of our supplier base to meet
the ongoing needs of our business. However, while volume
share decreased, in absolute terms volume produced in China
remained almost stable compared to the prior year. In 2008,
our footwear suppliers produced approximately 221 million
pairs of shoes (2007: approx. 201 million pairs). The year-over-
year increase was solely attributable to a higher sourcing vol-
ume at adidas while footwear purchases at Reebok declined.
Our largest footwear factory produced approximately 11% of the
footwear sourcing volume (2007: 11%).
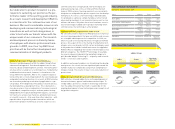
Footwear production 1)
in million pairs
2006 200
2007 201
2008 221
1) Figures only include adidas, Reebok and adidas Golf.