Reebok 2008 Annual Report Download - page 172
Download and view the complete annual report
Please find page 172 of the 2008 Reebok annual report below. You can navigate through the pages in the report by either clicking on the pages listed below, or by using the keyword search tool below to find specific information within the annual report.-
 1
1 -
2
-
3
-
4
-
5
-
6
-
7
-
8
-
9
-
10
-
11
-
12
-
13
-
14
-
15
-
16
-
17
-
18
-
19
-
20
-
21
-
22
-
23
-
24
-
25
-
26
-
27
-
28
-
29
-
30
-
31
-
32
-
33
-
34
-
35
-
36
-
37
-
38
-
39
-
40
-
41
-
42
-
43
-
44
-
45
-
46
-
47
-
48
-
49
-
50
-
51
-
52
-
53
-
54
-
55
-
56
-
57
-
58
-
59
-
60
-
61
-
62
-
63
-
64
-
65
-
66
-
67
-
68
-
69
-
70
-
71
-
72
-
73
-
74
-
75
-
76
-
77
-
78
-
79
-
80
-
81
-
82
-
83
-
84
-
85
-
86
-
87
-
88
-
89
-
90
-
91
-
92
-
93
-
94
-
95
-
96
-
97
-
98
-
99
-
100
-
101
-
102
-
103
-
104
-
105
-
106
-
107
-
108
-
109
-
110
-
111
-
112
-
113
-
114
-
115
-
116
-
117
-
118
-
119
-
120
-
121
-
122
-
123
-
124
-
125
-
126
-
127
-
128
-
129
-
130
-
131
-
132
-
133
-
134
-
135
-
136
-
137
-
138
-
139
-
140
-
141
-
142
-
143
-
144
-
145
-
146
-
147
-
148
-
149
-
150
-
151
-
152
-
153
-
154
-
155
-
156
-
157
-
158
-
159
-
160
-
161
-
 162
162 -
 163
163 -
 164
164 -
 165
165 -
 166
166 -
 167
167 -
 168
168 -
 169
169 -
 170
170 -
 171
171 -
 172
172 -
 173
173 -
 174
174 -
 175
175 -
 176
176 -
 177
177 -
 178
178 -
 179
179 -
 180
180 -
 181
181 -
 182
182 -
183
-
184
-
185
-
186
-
187
-
188
-
189
-
190
-
191
-
192
-
193
-
194
-
195
-
196
-
197
-
198
-
199
-
200
-
201
-
202
-
203
-
204
-
205
-
206
-
207
-
208
-
209
-
210
-
211
-
212
-
213
-
214
-
215
-
216
-
217
-
218
-
219
-
220
 |
 |

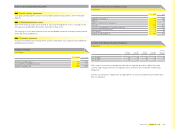
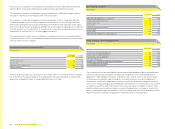
168 Consolidated Financial Statements Notes
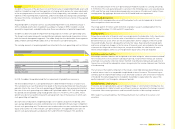
8 Inventories
Inventories by major classifi cation are as follows:
Inventories
€ in millions
Dec. 31, 2008 Dec. 31, 2007
Gross value
Allowance for
obsolescence Net value Gross value
Allowance for
obsolescence Net value
Finished goods and
merchandise on hand 1,463 82 1,381 1,187 75 1,112
Goods in transit 566 — 566 468 — 468
Raw materials 40 2 38 40 3 37
Work in progress 10 — 10 12 — 12
Inventories 2,079 84 1,995 1,707 78 1,629
Goods in transit mainly relate to shipments from suppliers in Asia to subsidiaries in Europe,
Asia and the Americas. The allowance for obsolescence mainly relates to gross inventories on
hand which amounted to € 491 million and € 431 million as at December 31, 2008 and 2007,
respectively see also Note 2.
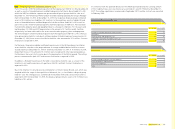
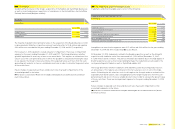
9 Other current assets
Other current assets consist of the following:
Other current assets
€ in millions
Dec. 31, 2008 Dec. 31, 2007
Prepaid expenses 292 274
Tax receivables other than income taxes 82 68
Financial assets
Interest rate derivatives 1 —
Currency options 22 23
Forward contracts 156 11
Security deposits 66 38
Other fi nancial assets 43 50
Sundry 129 67
Other current assets, gross 791 531
Less: allowance 2 2
Other current assets, net 789 529
Prepaid expenses relate mainly to promotion agreements and service contracts as well as rents.
Information in relation to forward contracts as well as currency options and interest rate deriva-
tives is also included in these Notes see Note 23.
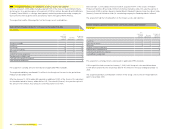
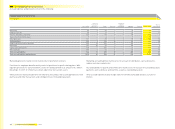
10 Property, plant and equipment
Property, plant and equipment consist of the following:
Property, plant and equipment
€ in millions
Dec. 31, 2008 Dec. 31, 2007
Land and buildings 489 430
Technical equipment and machinery 140 115
Other equipment, furniture and fi ttings 847 629
1,476 1,174
Less: accumulated depreciation 656 514
820 660
Construction in progress, net 66 42
Property, plant and equipment, net 886 702
Depreciation expenses were € 165 million and € 145 million for the years ending December 31,
2008 and 2007, respectively see also Note 25. Impairment losses which are included within
depreciation and amortisation (shown in other operating expenses see also Note 25) were
€ 6 million and € 3 million for the years ending December 31, 2008 and 2007, respectively. These
are related to assets within other equipment, furniture and fi ttings, mainly in the Group’s
own-retail activities, for which contrary to expectations there will be an insuffi cient fl ow of future
economic benefi ts.
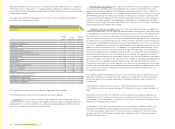
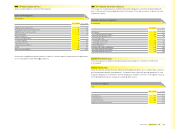
In 2008, assets amounting to € 41 million and € 3 million in connection with the unrealised sale
of disposal groups see Note 3 were transferred from “assets classifi ed as held-for-sale” to
“land and buildings” and “other equipment, furniture and fi ttings” within property, plant and
equipment respectively.
The reclassifi ed depreciation expenses consist of depreciation subsequently refl ected see also
Note 3 and the formerly reclassifi ed depreciation which has now been taken back.
Contractual commitments for the acquisition of property, plant and equipment mainly relate to
building projects in Herzogenaurach amounting to € 32 million.
For details see Statement of Movements of Tangible and Intangible Assets and Financial Assets (Attach-
ment I to these Notes).