Reebok 2008 Annual Report Download - page 85
Download and view the complete annual report
Please find page 85 of the 2008 Reebok annual report below. You can navigate through the pages in the report by either clicking on the pages listed below, or by using the keyword search tool below to find specific information within the annual report.-
 1
1 -
2
-
3
-
4
-
5
-
6
-
7
-
8
-
9
-
10
-
11
-
12
-
13
-
14
-
15
-
16
-
17
-
18
-
19
-
20
-
21
-
22
-
23
-
24
-
25
-
26
-
27
-
28
-
29
-
30
-
31
-
32
-
33
-
34
-
35
-
36
-
37
-
38
-
39
-
40
-
41
-
42
-
43
-
44
-
45
-
46
-
47
-
48
-
49
-
50
-
51
-
52
-
53
-
54
-
55
-
56
-
57
-
58
-
59
-
60
-
61
-
62
-
63
-
64
-
65
-
66
-
67
-
68
-
69
-
70
-
71
-
72
-
73
-
74
-
 75
75 -
 76
76 -
 77
77 -
 78
78 -
 79
79 -
 80
80 -
 81
81 -
 82
82 -
 83
83 -
 84
84 -
 85
85 -
 86
86 -
 87
87 -
 88
88 -
 89
89 -
 90
90 -
 91
91 -
 92
92 -
 93
93 -
 94
94 -
 95
95 -
96
-
97
-
98
-
99
-
100
-
101
-
102
-
103
-
104
-
105
-
106
-
107
-
108
-
109
-
110
-
111
-
112
-
113
-
114
-
115
-
116
-
117
-
118
-
119
-
120
-
121
-
122
-
123
-
124
-
125
-
126
-
127
-
128
-
129
-
130
-
131
-
132
-
133
-
134
-
135
-
136
-
137
-
138
-
139
-
140
-
141
-
142
-
143
-
144
-
145
-
146
-
147
-
148
-
149
-
150
-
151
-
152
-
153
-
154
-
155
-
156
-
157
-
158
-
159
-
160
-
161
-
162
-
163
-
164
-
165
-
166
-
167
-
168
-
169
-
170
-
171
-
172
-
173
-
174
-
175
-
176
-
177
-
178
-
179
-
180
-
181
-
182
-
183
-
184
-
185
-
186
-
187
-
188
-
189
-
190
-
191
-
192
-
193
-
194
-
195
-
196
-
197
-
198
-
199
-
200
-
201
-
202
-
203
-
204
-
205
-
206
-
207
-
208
-
209
-
210
-
211
-
212
-
213
-
214
-
215
-
216
-
217
-
218
-
219
-
220
 |
 |
adidas Group Annual Report 2008 081
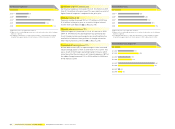
Quarterly consumer confi dence development
by region
Q4 2007 Q1 2008 Q2 2008 Q3 2008 Q4 2008
USA 1) 90.6 65.9 51.0 61.4 38.6
Euro Zone 2) (9) (12) (17) (19) (30)
Japan 3) 38.3 37.0 32.9 31.8 26.7
1) Source: Conference Board.
2) Source: European Commission.
3) Source: Economic and Social Research Institute, Government of Japan.
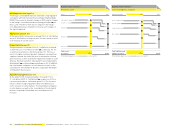
Exchange rate development 1)
€ 1 equals
Average
rate 2007 Q1 2008 Q2 2008 Q3 2008 Q4 2008
Average
rate 2008
USD 1.3709 1.5812 1.5764 1.4303 1.3917 1.4702
GBP 0.6845 0.7958 0.7923 0.7903 0.9525 0.7956
JPY 161.19 157.37 166.44 150.47 126.14 152.39
1) Spot rates at quarter-end.
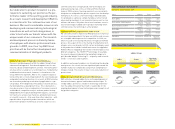
Global sporting goods industry hit by economic downturn
In 2008, growth of the sporting goods industry was affected by
slower economic expansion in most major markets. However,
the extent of the crisis differed from region to region. The
sporting goods markets in the USA and Western Europe were
the most hit while emerging markets continued to post signifi -
cant growth.
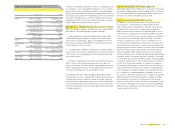
Mixed performance of European sporting goods industry
In 2008, the European sporting goods industry saw diverse
developments among the various markets. Despite the positive
impact of the UEFA EURO 2008™, all major Western European
countries posted a decline in sales. The UK led the downward
trend, being faced with a particularly tough retail environment.
Emerging markets continued to show a strong performance,
however at a slower pace than in the prior year.
The decline in Western Europe hit both the footwear and
apparel segment, albeit in diverse degrees. Declining volumes
accounted for the major part of the sales drop. Footwear
sales decreased at a mid- single-digit rate while apparel sales
declined at a high-single-digit rate. The decline in footwear
sales was driven by the outdoor, training and basketball
categories. Among the distribution channels, clothing stores,
general shoe stores and sports shoe stores declined at a
double-digit rate while sporting goods stores were able to
outperform the market, although they were still down.
US sporting goods industry endures tough retail market
In the US sporting goods industry, the sales trends differed
signifi cantly by category. Footwear sales grew, while apparel
sales declined.
The slight expansion of footwear sales was supported by an
increase in average selling prices. The main contributor to
the sales growth was the running category (mid-single-digit
growth), while basketball, lifestyle and training decreased.
Apparel sales were down low-single-digit as average sell-
ing prices declined. The sales drop was driven by the training
category, which declined at a high-single-digit rate, and to a
lesser extent by the basketball category.
From a channel perspective, sales also developed differently
by category. The family footwear channel increased at a mid-
single-digit rate. The sporting goods and mall athletic specialty
channels, however, were down at a low-single-digit rate. In
apparel, the sporting goods channel increased sales, while the
mall athletic specialty and family/volume channels were down
double-digit.
Asian sporting goods industry driven by emerging markets
The Asian sporting goods industry showed continued double-
digit growth in 2008, driven by most major markets. The
emerging markets were the primary driver of growth, supported
by increasing consumer demand and continued retail expan-
sion. In addition, the Olympic Games held in Beijing raised
awareness for sports among the Chinese population and in
neighbouring countries.
Despite weak private consumption in Japan, the industry grew
at a mid-single-digit rate in 2008. Sales in footwear increased
at a mid-single-digit rate, while apparel sales grew at a low-
single-digit rate.
Latin American sporting goods market increases
In Latin America, the sporting goods market developed in
line with the overall economy and grew at a single-digit rate
compared to the prior year. Both apparel and footwear sales
increased in 2008 compared to the prior year, refl ecting higher
consumer spending in the region.
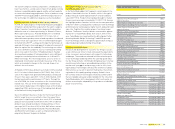
adidas Group outpaces overall economic and industry growth
In 2008, adidas Group revenues grew faster than both the
global economy and the sporting goods industry in all regions,
with the exception of North America. From a macroeconomic
perspective, the two most important indicators of how
conducive a region’s economic development is to our business
are GDP growth and consumer confi dence. Performance in the
sporting goods industry, however, is often more infl uenced by
product category trends, development of key retail partners as
well as pricing and volume trends in the sector.
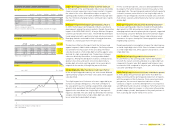
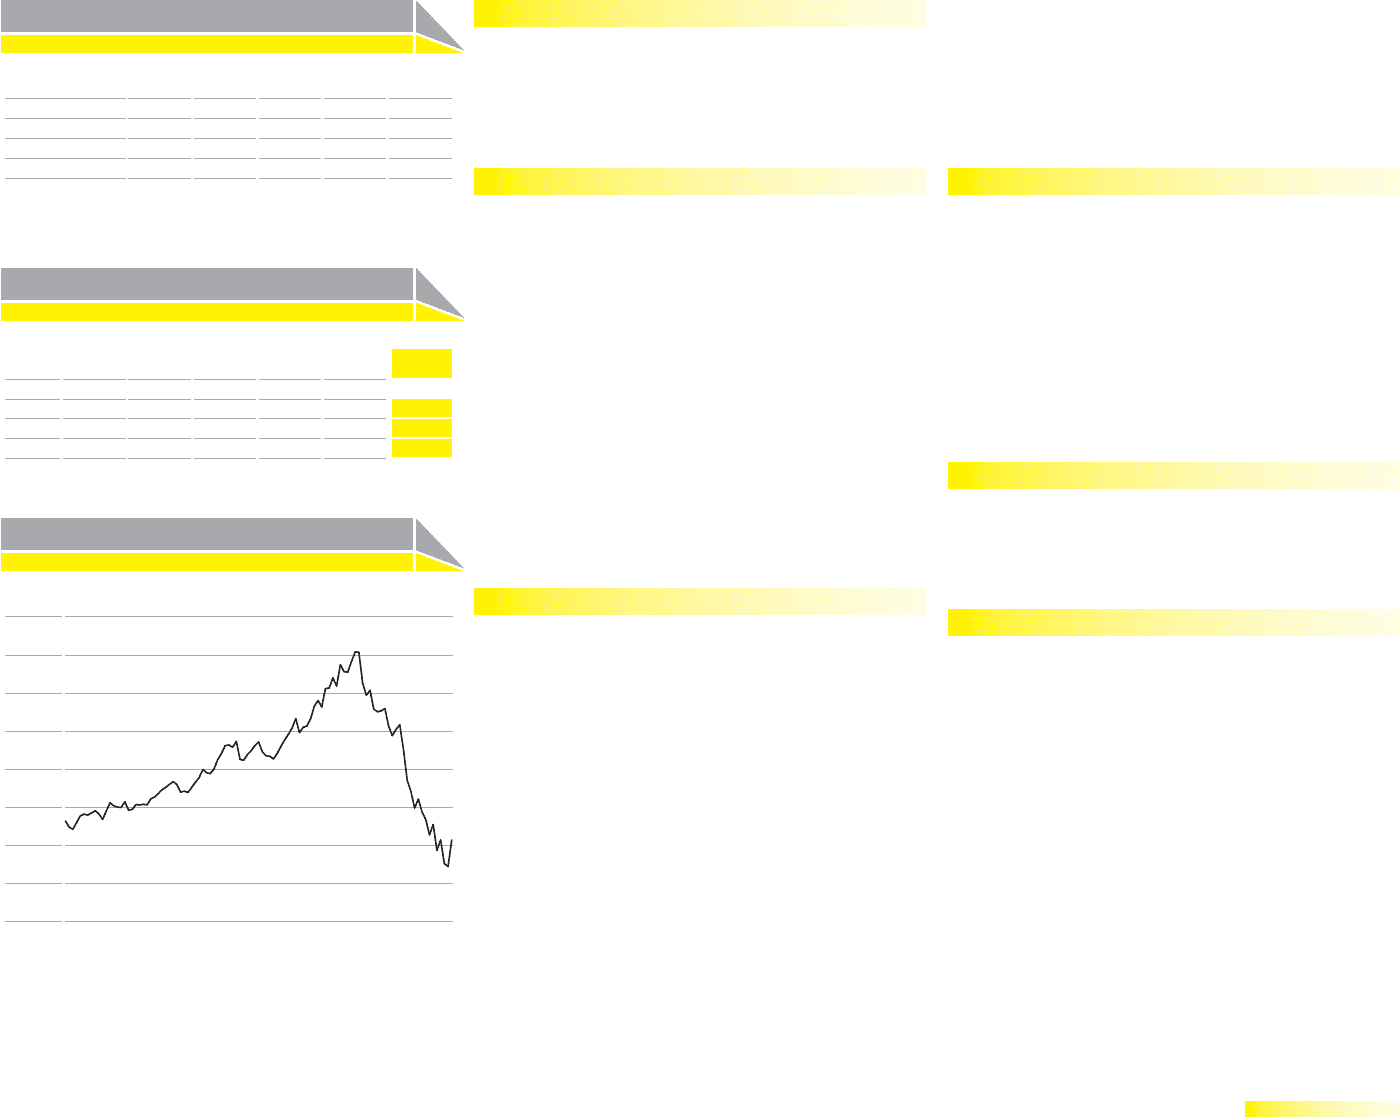
Oil price development 1)
in US $
Jan. 1, 2007 Dec. 31, 2008
120
80
40
0
1) West Texas Intermediate Cushing crude oil.
Source: Bloomberg.