Reebok 2008 Annual Report Download - page 88
Download and view the complete annual report
Please find page 88 of the 2008 Reebok annual report below. You can navigate through the pages in the report by either clicking on the pages listed below, or by using the keyword search tool below to find specific information within the annual report.
084 Group Management Report – Our Financial Year Group Business Performance — Income Statement
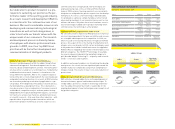
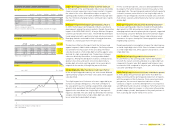
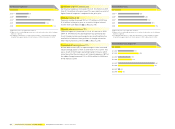
2008 net sales by product category
Footwear 46% Hardware 10%
Apparel 44%
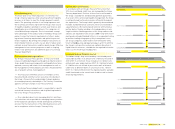
Net sales by product category
€ in millions
Footwear Apparel Hardware Total 1)
2004 2) 2,620 2,462 778 5,860
2005 2) 2,978 2,798 860 6,636
2006 3) 4,733 4,105 1,246 10,084
2007 4,751 4,426 1,121 10,299
2008 4,919 4,775 1,106 10,799
1) Rounding differences may arise in totals.
2) Figures refl ect continuing operations as a result of the divestiture of the Salomon
business segment.
3) Including Reebok business segment from February 1, 2006 onwards. Including
Greg Norman apparel business from February 1, 2006 to November 30, 2006.
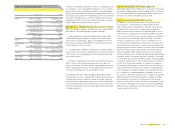
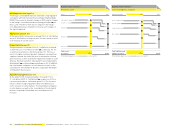
Currency translation effects negatively impacted sales in euro
terms in all regions. In euro terms, sales in Europe increased
7% to € 4.665 billion in 2008 from € 4.369 billion in 2007. Sales
in North America decreased 14% to € 2.520 billion in 2008
from € 2.929 billion in the prior year. Revenues in Asia grew
18% to € 2.662 billion in 2008 from € 2.254 billion in 2007.
Sales in Latin America grew 36% to € 893 million in 2008 from
€ 657 million in the prior year.
Currency-neutral apparel revenues advance
at a double-digit rate
From a product category perspective, currency-neutral
Group sales growth was driven by increases in all categories.
Currency-neutral footwear sales increased 8% during the
period. This development was driven by double-digit growth in
the adidas and TaylorMade-adidas Golf segments, while the
Reebok segment remained stable. Apparel sales grew 12% on
a currency-neutral basis, driven by double-digit increases in
the adidas and TaylorMade-adidas Golf segments, while sales
in the Reebok segment declined. Currency-neutral hardware
sales increased 4% compared to the prior year due to improve-
ments in all segments.
Currency translation effects negatively impacted sales in all
product categories in euro terms. Footwear sales in euro terms
increased 4% to € 4.919 billion in 2008 (2007: € 4.751 bil-
lion). Apparel sales grew 8% to € 4.775 billion in 2008 from
€ 4.426 billion in the prior year. Hardware sales decreased 1%
to € 1.106 billion in 2008 from € 1.121 billion in 2007.
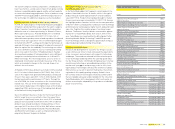
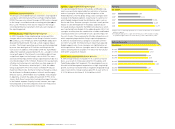
Cost of sales increases modestly
Cost of sales is defi ned as the amount we pay to third parties
for expenses associated with producing and delivering our
products. Own-production expenses are also included in the
Group’s cost of sales. However, these expenses represent only
a very small portion of total cost of sales. In 2008, cost of sales
was € 5.543 billion, representing an increase of 2% compared
to € 5.417 billion in 2007. The increase was below sales growth
due to the optimisation of sourcing processes and effi ciency
gains within our supply chain which more than offset increas-
ing labour and raw material costs.
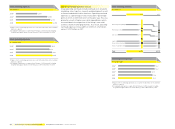
Gross margin reaches record level of 48.7%
The gross margin of the adidas Group increased 1.3 percent-
age points to 48.7% in 2008 (2007: 47.4%). This is the highest
annual gross margin for the Group since the IPO in 1995. This
development exceeded Management’s initial expectation of a
gross margin between 47.5 and 48.0%. The improvement was
mainly due to an improving regional mix, further own-retail
expansion and a more favourable product mix. Currency
movements also supported this development. Cost synergies
resulting from the combination of adidas and Reebok sourc-
ing activities also continued to have a positive impact. As a
result, gross profi t for the adidas Group rose 8% in 2008 to
reach € 5.256 billion versus € 4.882 billion in the prior year.
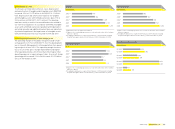
Royalty and commission income decreases
Royalty and commission income for the adidas Group decreased
9% on a currency-neutral basis. This development is mainly
due to the non-recurrence of royalties from distribution part-
ners in the Reebok segment in Brazil /Paraguay and Argentina
in 2008. The distribution partnerships in these countries were
replaced by own companies whose sales were consolidated for
the fi rst time in 2008. In euro terms, royalty and commission
income decreased 13% to € 89 million in 2008 from € 102 mil-
lion in the prior year.


