Reebok 2008 Annual Report Download - page 94
Download and view the complete annual report
Please find page 94 of the 2008 Reebok annual report below. You can navigate through the pages in the report by either clicking on the pages listed below, or by using the keyword search tool below to find specific information within the annual report.-
 1
1 -
2
-
3
-
4
-
5
-
6
-
7
-
8
-
9
-
10
-
11
-
12
-
13
-
14
-
15
-
16
-
17
-
18
-
19
-
20
-
21
-
22
-
23
-
24
-
25
-
26
-
27
-
28
-
29
-
30
-
31
-
32
-
33
-
34
-
35
-
36
-
37
-
38
-
39
-
40
-
41
-
42
-
43
-
44
-
45
-
46
-
47
-
48
-
49
-
50
-
51
-
52
-
53
-
54
-
55
-
56
-
57
-
58
-
59
-
60
-
61
-
62
-
63
-
64
-
65
-
66
-
67
-
68
-
69
-
70
-
71
-
72
-
73
-
74
-
75
-
76
-
77
-
78
-
79
-
80
-
81
-
82
-
83
-
 84
84 -
 85
85 -
 86
86 -
 87
87 -
 88
88 -
 89
89 -
 90
90 -
 91
91 -
 92
92 -
 93
93 -
 94
94 -
 95
95 -
 96
96 -
 97
97 -
 98
98 -
 99
99 -
 100
100 -
 101
101 -
 102
102 -
 103
103 -
 104
104 -
105
-
106
-
107
-
108
-
109
-
110
-
111
-
112
-
113
-
114
-
115
-
116
-
117
-
118
-
119
-
120
-
121
-
122
-
123
-
124
-
125
-
126
-
127
-
128
-
129
-
130
-
131
-
132
-
133
-
134
-
135
-
136
-
137
-
138
-
139
-
140
-
141
-
142
-
143
-
144
-
145
-
146
-
147
-
148
-
149
-
150
-
151
-
152
-
153
-
154
-
155
-
156
-
157
-
158
-
159
-
160
-
161
-
162
-
163
-
164
-
165
-
166
-
167
-
168
-
169
-
170
-
171
-
172
-
173
-
174
-
175
-
176
-
177
-
178
-
179
-
180
-
181
-
182
-
183
-
184
-
185
-
186
-
187
-
188
-
189
-
190
-
191
-
192
-
193
-
194
-
195
-
196
-
197
-
198
-
199
-
200
-
201
-
202
-
203
-
204
-
205
-
206
-
207
-
208
-
209
-
210
-
211
-
212
-
213
-
214
-
215
-
216
-
217
-
218
-
219
-
220
 |
 |
090 Group Management Report – Our Financial Year Group Business Performance — Balance Sheet and Cash Flow Statement
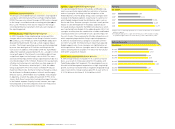
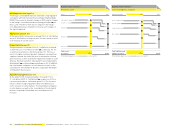
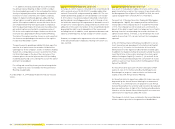
Balance sheet structure 1)
in % of total liabilities and equity
Liabilities and equity 2008 2007
Total liabilities and
equity (€ in millions) 9,533 8,325
1) For absolute fi gures see Consolidated Balance Sheet, p. 152.
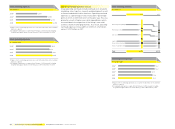
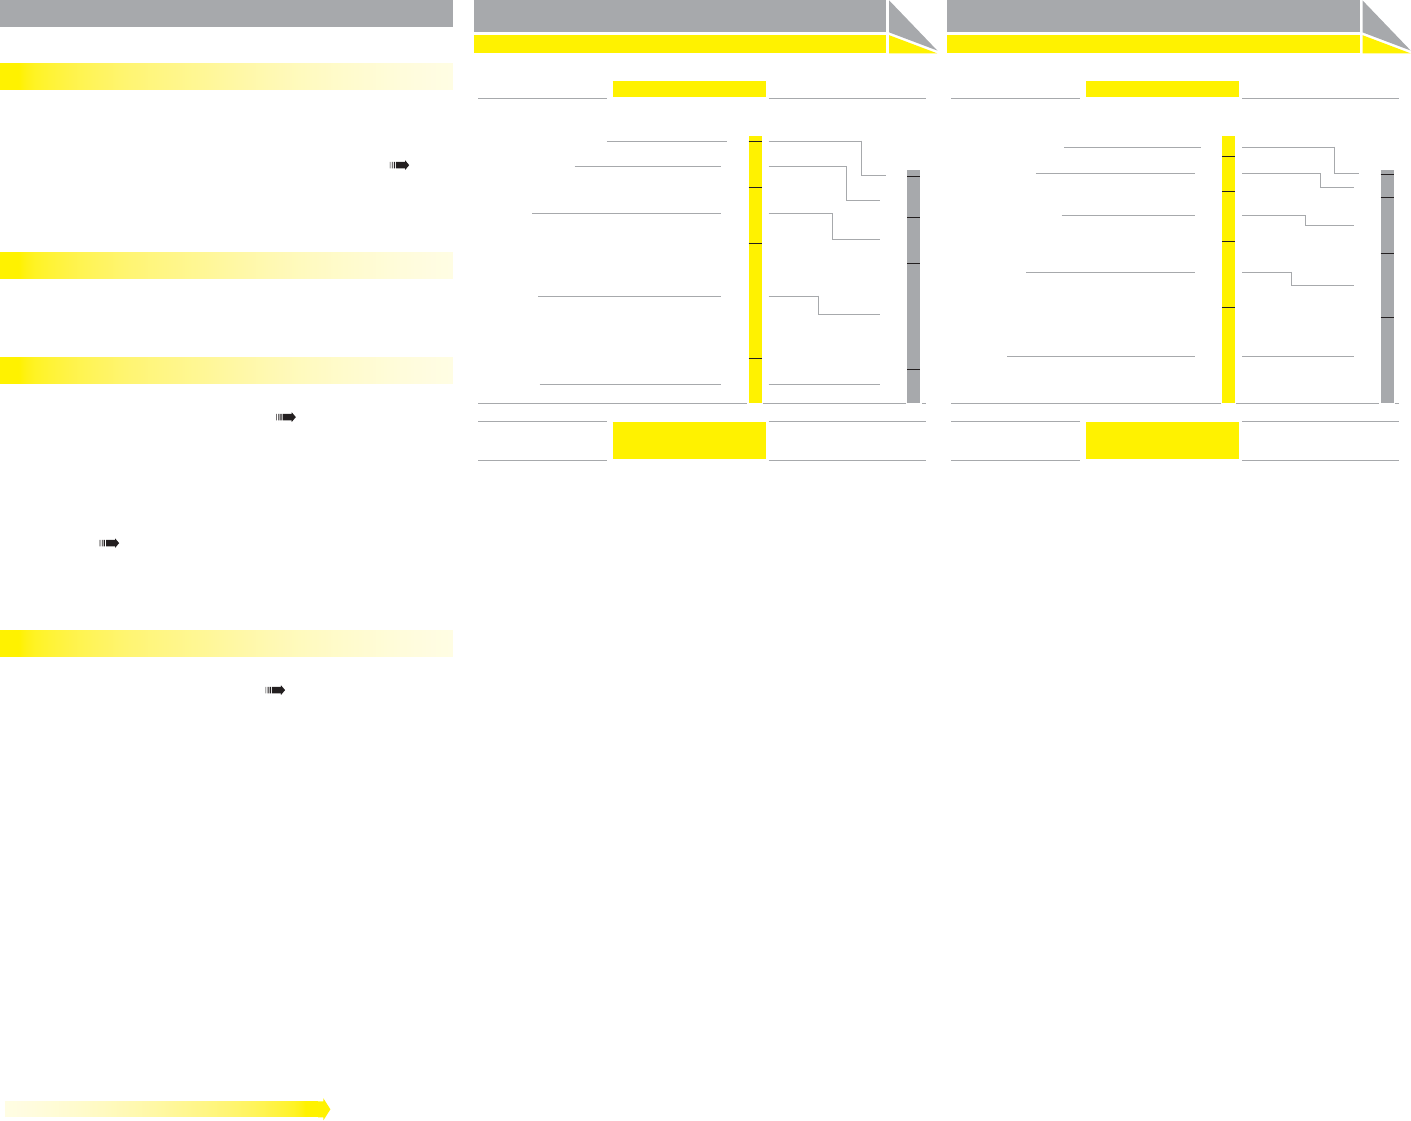
Balance sheet structure 1)
in % of total assets
Assets 2008 2007
Total assets
(€ in millions) 9,533 8,325
1) For absolute fi gures see Consolidated Balance Sheet, p. 152.
Total equity 35.7
Other liabilities 24.5
Long-term borrowings 18.6
Accounts payable 12.8
Short-term borrowings 8.4
Other assets 16.8
Fixed assets 42.7
Inventories 20.9
Accounts receivable 17.0
Cash and cash equivalents 2.6
36.4
27.6
23.6
10.2
2.2
14.6
44.8
19.6
17.5
3.5
Balance Sheet and Cash Flow Statement
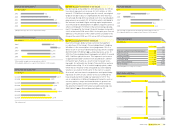
No change in accounting policy
The Group’s consolidated fi nancial statements are prepared in
accordance with International Financial Reporting Standards
(IFRS). There were no relevant changes in IFRS and no changes
in the Group’s consolidation and accounting principles see
Note 1, p. 157. Therefore, there was no impact on the Group’s
consolidated fi nancial statements from any such changes in
the reporting period.
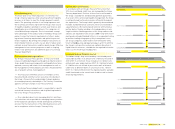
Total assets increase 15%
At the end of 2008, total assets increased 15% to € 9.533 billion
versus € 8.325 billion in the prior year. This was mainly a result
of an increase in current assets.
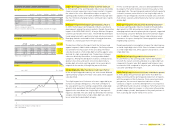
Group inventories up 22%
Group inventories increased 22% to € 1.995 billion at the end
of 2008 versus € 1.629 billion in 2007 see Note 8, p. 168. On
a currency-neutral basis, inventories grew 21%. This was a
result of a higher volume of product shipments received from
suppliers towards the end of the year in anticipation of future
price increases as well as potential regulatory changes in Latin
America. Hesitant customer order patterns also impacted this
development see Risk and Opportunity Report, p. 107. In addition,
the new Reebok companies in Latin America as well as the
consolidation of the Ashworth business acquired in November
contributed to the increase.
Accounts receivable increase 11%
At the end of 2008, Group receivables increased 11% to
€ 1.624 billion (2007: € 1.459 billion) see Note 7, p. 167. On a
currency- neutral basis, receivables grew 13%. This increase
refl ects slower receipt of payments due to the diffi cult eco-
nomic situation in some markets. The new Reebok companies
in Latin America as well as the consolidation of the Ashworth
business acquired in November also contributed to this
increase.