Reebok 2008 Annual Report Download - page 170
Download and view the complete annual report
Please find page 170 of the 2008 Reebok annual report below. You can navigate through the pages in the report by either clicking on the pages listed below, or by using the keyword search tool below to find specific information within the annual report.-
 1
1 -
2
-
3
-
4
-
5
-
6
-
7
-
8
-
9
-
10
-
11
-
12
-
13
-
14
-
15
-
16
-
17
-
18
-
19
-
20
-
21
-
22
-
23
-
24
-
25
-
26
-
27
-
28
-
29
-
30
-
31
-
32
-
33
-
34
-
35
-
36
-
37
-
38
-
39
-
40
-
41
-
42
-
43
-
44
-
45
-
46
-
47
-
48
-
49
-
50
-
51
-
52
-
53
-
54
-
55
-
56
-
57
-
58
-
59
-
60
-
61
-
62
-
63
-
64
-
65
-
66
-
67
-
68
-
69
-
70
-
71
-
72
-
73
-
74
-
75
-
76
-
77
-
78
-
79
-
80
-
81
-
82
-
83
-
84
-
85
-
86
-
87
-
88
-
89
-
90
-
91
-
92
-
93
-
94
-
95
-
96
-
97
-
98
-
99
-
100
-
101
-
102
-
103
-
104
-
105
-
106
-
107
-
108
-
109
-
110
-
111
-
112
-
113
-
114
-
115
-
116
-
117
-
118
-
119
-
120
-
121
-
122
-
123
-
124
-
125
-
126
-
127
-
128
-
129
-
130
-
131
-
132
-
133
-
134
-
135
-
136
-
137
-
138
-
139
-
140
-
141
-
142
-
143
-
144
-
145
-
146
-
147
-
148
-
149
-
150
-
151
-
152
-
153
-
154
-
155
-
156
-
157
-
158
-
159
-
 160
160 -
 161
161 -
 162
162 -
 163
163 -
 164
164 -
 165
165 -
 166
166 -
 167
167 -
 168
168 -
 169
169 -
 170
170 -
 171
171 -
 172
172 -
 173
173 -
 174
174 -
 175
175 -
 176
176 -
 177
177 -
 178
178 -
 179
179 -
 180
180 -
181
-
182
-
183
-
184
-
185
-
186
-
187
-
188
-
189
-
190
-
191
-
192
-
193
-
194
-
195
-
196
-
197
-
198
-
199
-
200
-
201
-
202
-
203
-
204
-
205
-
206
-
207
-
208
-
209
-
210
-
211
-
212
-
213
-
214
-
215
-
216
-
217
-
218
-
219
-
220
 |
 |

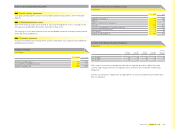
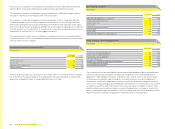
166 Consolidated Financial Statements Notes
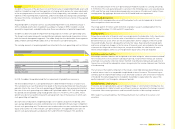
Effective November 20, 2008, as a result of a takeover bid, Taylor Made Golf Co., Inc. acquired
100% of the shares of Ashworth, Inc., including all direct and indirect holdings for a purchase
price of US $ 30 million. Based in Carlsbad /California (USA), Ashworth is a well-established golf
lifestyle apparel brand.
The acquisition had the following effect on the Group’s assets and liabilities (based on a
preliminary purchase price allocation):
Ashworth, Inc.’s net assets at the acquisition date
€ in millions
Pre-
acquisition
carrying
amounts
Fair value
adjustments
Recognised
values on
acquisition
Cash and cash equivalents 2 — 2
Accounts receivable 20 — 20
Inventories 27 3 30
Other current assets 2 — 2
Property, plant and equipment, net 21 2 23
Trademarks and other intangible assets, net 3 34 37
Deferred tax assets 1 4 5
Borrowings (37) — (37)
Accounts payable (15) — (15)
Income taxes (0) — (0)
Accrued liabilities and provisions (6) (1) (7)
Other current liabilities (2) — (2)
Deferred tax liabilities 0 (14) (14)
Net assets 16 28 44
Negative goodwill arising on acquisition
(recognised in the income statement) 21
Purchase price settled in cash 23
Cash and cash equivalents acquired 2
Cash outfl ow on acquisition 21
Pre-acquisition carrying amounts were based on applicable IFRS standards.
The following valuation methods for the acquired assets were applied:
—
Inventories: The “pro rata basis valuation” was applied for estimating the fair value of
acquired inventories. Realised margins were added to the book values of acquired inventories.
Subsequently, the costs for completion for selling, advertising and general administration as
well as a reasonable profi t allowance were deducted.
—
Property, plant and equipment: The “indirect cost method” of the cost approach was applied
for the valuation of property, plant and equipment. The comparison method of the market
approach was exclusively applied to the valuation of embroidery machines. In the “indirect cost
method” of the cost approach, the cost of reproduction new for each asset or group of assets was
determined by indexing the original capitalised cost. If necessary, allowances have been taken
into account for physical depreciation, functional and economic obsolescence. The “comparison
method” of the market approach was applied by estimating prices of comparable embroidery
machines in terms of age, make and model. Indirect cost estimates such as freight, installation
and set-up were also included in the valuation.
—
Trademarks and other intangible assets: The “relief-from-royalty method” was applied for
trademarks /trade names. The fair value was determined by discounting the royalty savings after
tax and adding a tax amortisation benefi t, resulting from the amortisation of the acquired asset.
For the valuation of customer relationships, the “multi-period-excess-earnings method” was
used. The respective future excess cash fl ows were identifi ed and adjusted in order to eliminate
all elements not associated with these assets. Future cash fl ows were measured on the basis of
the expected sales by deducting variable and sales-related imputed costs for the use of contribu-
tory assets. Subsequently, the outcome was discounted using the appropriate discount rate and
adding a tax amortisation benefi t. The “cost approach” was applied for apparel designs. These
were valued as the cost to recreate the current design plus the opportunity cost measured as
the cash fl ow impact between having pre-existing designs versus having to recreate the designs
plus amortisation tax benefi t. The “discounted cash fl ow method” was applied for covenants
not-to-compete by comparing the estimated prospective cash fl ows with and without the subject
agreements in place. The value of the covenants not-to-compete is the difference between these
discounted cash fl ows being discounted to present value at the appropriate discount rate. For
the valuation of backlogs, the “income approach” was used. The corresponding cash fl ows were
based on the estimated exhaustion of the backlog, and discounted with an appropriate discount
rate. Charges for the use of contributory assets and an amortisation tax benefi t were also
included in the calculation.
The negative goodwill resulted from the excess of net assets (fair values assigned to all assets
acquired less liabilities assumed) versus the acquisition cost paid, due to a massive decrease
in the share price of the company acquired, also taking the respective deferred taxes into
consideration.
If this acquisition had occurred on January 1, 2008, total Group net sales would have been
€ 10.9 billion and net income would have been € 611 million for the year ending December 31,
2008.
Mainly due to restructuring costs and other one-time expenses, the acquired subsidiary con-
tributed losses of € 13 million to the Group’s total operating result since the inclusion in the
consolidated fi nancial statements. Contribution to net income cannot be disclosed due to the
integration of fi nancing and tax activities.
On November 9, 2007, the Group acquired the assets and liabilities of Mitchell & Ness, Inc.,
based in Philadelphia /Pennsylvania (USA), as part of an asset deal. The purchase price of
€ 2 million was paid for inventories (€ 1 million), accounts receivable (€ 1 million), accounts
payable (negative € 3 million) and remaining other intangible assets (€ 3 million) based on a
purchase price allocation.