Reebok 2008 Annual Report Download - page 210
Download and view the complete annual report
Please find page 210 of the 2008 Reebok annual report below. You can navigate through the pages in the report by either clicking on the pages listed below, or by using the keyword search tool below to find specific information within the annual report.-
 1
1 -
2
-
3
-
4
-
5
-
6
-
7
-
8
-
9
-
10
-
11
-
12
-
13
-
14
-
15
-
16
-
17
-
18
-
19
-
20
-
21
-
22
-
23
-
24
-
25
-
26
-
27
-
28
-
29
-
30
-
31
-
32
-
33
-
34
-
35
-
36
-
37
-
38
-
39
-
40
-
41
-
42
-
43
-
44
-
45
-
46
-
47
-
48
-
49
-
50
-
51
-
52
-
53
-
54
-
55
-
56
-
57
-
58
-
59
-
60
-
61
-
62
-
63
-
64
-
65
-
66
-
67
-
68
-
69
-
70
-
71
-
72
-
73
-
74
-
75
-
76
-
77
-
78
-
79
-
80
-
81
-
82
-
83
-
84
-
85
-
86
-
87
-
88
-
89
-
90
-
91
-
92
-
93
-
94
-
95
-
96
-
97
-
98
-
99
-
100
-
101
-
102
-
103
-
104
-
105
-
106
-
107
-
108
-
109
-
110
-
111
-
112
-
113
-
114
-
115
-
116
-
117
-
118
-
119
-
120
-
121
-
122
-
123
-
124
-
125
-
126
-
127
-
128
-
129
-
130
-
131
-
132
-
133
-
134
-
135
-
136
-
137
-
138
-
139
-
140
-
141
-
142
-
143
-
144
-
145
-
146
-
147
-
148
-
149
-
150
-
151
-
152
-
153
-
154
-
155
-
156
-
157
-
158
-
159
-
160
-
161
-
162
-
163
-
164
-
165
-
166
-
167
-
168
-
169
-
170
-
171
-
172
-
173
-
174
-
175
-
176
-
177
-
178
-
179
-
180
-
181
-
182
-
183
-
184
-
185
-
186
-
187
-
188
-
189
-
190
-
191
-
192
-
193
-
194
-
195
-
196
-
197
-
198
-
199
-
 200
200 -
 201
201 -
 202
202 -
 203
203 -
 204
204 -
 205
205 -
 206
206 -
 207
207 -
 208
208 -
 209
209 -
 210
210 -
 211
211 -
 212
212 -
 213
213 -
 214
214 -
 215
215 -
 216
216 -
 217
217 -
 218
218 -
 219
219 -
 220
220
 |
 |

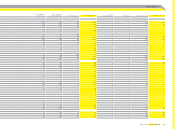
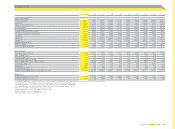
206 Consolidated Financial Statements Ten-year overview
Ten-year overview
2008 2007 2006 1) 2005 2004 2003 2002 2001 2000 1999
Income Statement Data (€ in millions)
Net sales 2) 10,799 10,299 10,084 6,636 5,860 6,267 6,523 6,112 5,835 5,354
Gross profi t 2) 5,256 4,882 4,495 3,197 2,813 2,814 2,819 2,601 2,528 2,352
Royalty and commission income 2) 89 102 90 47 42 42 46 42 43 35
Other operating income 2) 103 80 55 36 n /a n /a n /a n /a n /a n /a
Other operating expenses 2) 4,378 4,115 3,759 2,573 n /a n /a n /a n /a n /a n /a
Total operating income and expenses 2) 4,275 4,035 3,704 2,537 2,236 2,324 2,343 2,126 2,091 1,870
Operating profi t 2) 3) 1,070 949 881 707 584 490 477 475 437 482
Financial result 2) 4) (166) (135) (158) (52) (59) (49) (87) (102) (94) (84)
Income before taxes 2) 4) 904 815 723 655 526 438 390 376 347 398
Income taxes 2) 260 260 227 221 193 167 148 147 140 153
Minority interests 2) 4) (2) (4) (13) (8) (7) (11) (14) (21) (25) (18)
Net income attributable to shareholders 5) 642 551 483 383 314 260 229 208 182 228
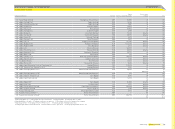
Income Statement Ratios
Gross margin 2) 48.7% 47.4% 44.6% 48.2% 48.0% 44.9% 43.2% 42.6% 43.3% 43.9%
Other operating income and expenses as a percentage of net sales 2) 39.6% 39.2% 36.7% 38.2% 38.2% 37.1% 35.9% 34.8% 35.8% 34.9%
Operating margin 2) 3) 9.9% 9.2% 8.7% 10.7% 10.0% 7.8% 7.3% 7.8% 7.5% 9.0%
Interest coverage 2) 7.4 6.8 5.9 18.4 10.2 8.4 6.4 4.9 4.6 6.1
Effective tax rate 2) 28.8% 31.8% 31.4% 33.7% 36.7% 38.0% 37.9% 39.0% 40.3% 38.4%
Net income attributable to shareholders as a percentage of net sales 5) 5.9% 5.4% 4.8% 5.8% 5.4% 4.2% 3.5% 3.4% 3.1% 4.3%
Balance Sheet Data (€ in millions)
Total assets 4) 9,533 8,325 8,379 5,750 4,434 4,188 4,261 4,183 4,018 3,587
Inventories 1,995 1,629 1,607 1,230 1,155 1,164 1,190 1,273 1,294 1,045
Receivables and other current assets 2,523 2,048 1,913 1,551 1,425 1,335 1,560 1,520 1,387 1,234
Working capital 4) 1,290 1,522 1,733 2,644 1,336 1,433 1,445 1,485 1,417 1,096
Net borrowings 2,189 1,766 2,231 (551) 665 1,018 1,498 1,679 1,791 1,591
Shareholders’ equity 4) 3,386 3,023 2,828 2,684 1,544 1,285 1,081 1,015 815 680
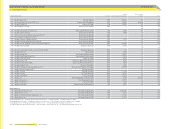
1) Including Reebok business segment from February 1, 2006 onwards. Including Greg Norman apparel business from February 1, 2006 to November 30, 2006.
2) 2004 and 2005 refl ect continuing operations as a result of the divestiture of the Salomon business segment.
3) Operating profi t fi gures prior to 2004 exclude royalty and commission income and goodwill amortisation.
4) 2003 and 2004 fi gures have been restated due to application of IAS 32/IAS 39 and amendment to IAS 19.
5) Includes income from continuing and discontinued operations.
6) Figures adjusted for 1: 4 share split conducted on June 6, 2006.
7) Subject to Annual General Meeting approval.
8) Based on number of shares outstanding at year-end.