Reebok 2008 Annual Report Download - page 89
Download and view the complete annual report
Please find page 89 of the 2008 Reebok annual report below. You can navigate through the pages in the report by either clicking on the pages listed below, or by using the keyword search tool below to find specific information within the annual report.-
 1
1 -
2
-
3
-
4
-
5
-
6
-
7
-
8
-
9
-
10
-
11
-
12
-
13
-
14
-
15
-
16
-
17
-
18
-
19
-
20
-
21
-
22
-
23
-
24
-
25
-
26
-
27
-
28
-
29
-
30
-
31
-
32
-
33
-
34
-
35
-
36
-
37
-
38
-
39
-
40
-
41
-
42
-
43
-
44
-
45
-
46
-
47
-
48
-
49
-
50
-
51
-
52
-
53
-
54
-
55
-
56
-
57
-
58
-
59
-
60
-
61
-
62
-
63
-
64
-
65
-
66
-
67
-
68
-
69
-
70
-
71
-
72
-
73
-
74
-
75
-
76
-
77
-
78
-
 79
79 -
 80
80 -
 81
81 -
 82
82 -
 83
83 -
 84
84 -
 85
85 -
 86
86 -
 87
87 -
 88
88 -
 89
89 -
 90
90 -
 91
91 -
 92
92 -
 93
93 -
 94
94 -
 95
95 -
 96
96 -
 97
97 -
 98
98 -
 99
99 -
100
-
101
-
102
-
103
-
104
-
105
-
106
-
107
-
108
-
109
-
110
-
111
-
112
-
113
-
114
-
115
-
116
-
117
-
118
-
119
-
120
-
121
-
122
-
123
-
124
-
125
-
126
-
127
-
128
-
129
-
130
-
131
-
132
-
133
-
134
-
135
-
136
-
137
-
138
-
139
-
140
-
141
-
142
-
143
-
144
-
145
-
146
-
147
-
148
-
149
-
150
-
151
-
152
-
153
-
154
-
155
-
156
-
157
-
158
-
159
-
160
-
161
-
162
-
163
-
164
-
165
-
166
-
167
-
168
-
169
-
170
-
171
-
172
-
173
-
174
-
175
-
176
-
177
-
178
-
179
-
180
-
181
-
182
-
183
-
184
-
185
-
186
-
187
-
188
-
189
-
190
-
191
-
192
-
193
-
194
-
195
-
196
-
197
-
198
-
199
-
200
-
201
-
202
-
203
-
204
-
205
-
206
-
207
-
208
-
209
-
210
-
211
-
212
-
213
-
214
-
215
-
216
-
217
-
218
-
219
-
220
 |
 |

adidas Group Annual Report 2008 085
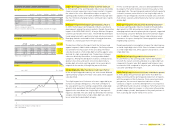
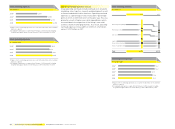
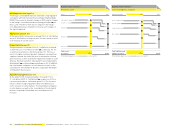
Gross margin
in %
2004 1) 48.0
2005 1) 48.2
2006 2) 44.6
2007 47.4
2008 48.7
1) Figures refl ect continuing operations as a result of the divestiture of the Salomon
business segment.
2) Including Reebok business segment from February 1, 2006 onwards. Including
Greg Norman apparel business from February 1, 2006 to November 30, 2006.
Gross profi t
€ in millions
2004 1) 2,813
2005 1) 3,197
2006 2) 4,495
2007 4,882
2008 5,256
1) Figures refl ect continuing operations as a result of the divestiture of the Salomon
business segment.
2) Including Reebok business segment from February 1, 2006 onwards. Including
Greg Norman apparel business from February 1, 2006 to November 30, 2006.
Gross profi t by quarter
€ in millions
Q1 2007
Q1 2008
1,188
1,288
Q2 2007
Q2 2008
1,138
1,263
Q3 2007
Q3 2008
1,429
1,511
Q4 2007
Q4 2008
1,127
1,194
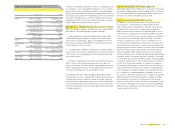
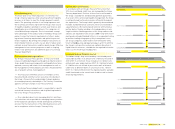
Other operating income grows 28%
Other operating income includes items such as releases
of accruals and provisions and gains from the disposal of
fi xed assets see Note 24, p. 186. Other operating income
increased 28% to € 103 million in 2008 from € 80 million in
2007. This development is mainly due to one-time book gains
in connection with the acquisition of Ashworth (€ 21 million)
and the divestiture of the Maxfl i business (€ 5 million) see
TaylorMade-adidas Golf Business Performance, p. 105.
Higher other operating expenses as a percentage of sales
Other operating expenses, including depreciation and amorti-
sation, consist of items such as marketing working budget and
operating overhead costs see Note 25, p. 187. Other operating
expenses as a percentage of sales increased 0.6 percentage
points to 40.5% in 2008 from 40.0% in 2007. Higher expenses
to support the Group’s growth in emerging markets were
partly offset by effi ciency improvements and a slight decrease
in marketing working budget expenditure as a percentage of
sales. In absolute terms, other operating expenses increased
6% to € 4.378 billion in 2008 from € 4.115 billion in the prior
year.
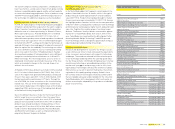
Marketing working budget decreases as a percentage of sales
Marketing working budget consists of items such as expenses
for promotion partnerships, advertising, retail presentation
and public relations. The Group’s marketing working budget
as a percentage of sales decreased 0.2 percentage points
to 13.2% in 2008 (2007: 13.4%). Higher expenses related to
the major sporting events in 2008 were offset by the adidas
Group’s strong revenue growth. In absolute terms, marketing
working budget increased 4% to € 1.429 billion in 2008 from
€ 1.378 billion in the prior year.