Reebok 2008 Annual Report Download - page 3
Download and view the complete annual report
Please find page 3 of the 2008 Reebok annual report below. You can navigate through the pages in the report by either clicking on the pages listed below, or by using the keyword search tool below to find specific information within the annual report.-
 1
1 -
 2
2 -
 3
3 -
 4
4 -
 5
5 -
 6
6 -
 7
7 -
 8
8 -
 9
9 -
 10
10 -
 11
11 -
 12
12 -
 13
13 -
 14
14 -
15
-
16
-
17
-
18
-
19
-
20
-
21
-
22
-
23
-
24
-
25
-
26
-
27
-
28
-
29
-
30
-
31
-
32
-
33
-
34
-
35
-
36
-
37
-
38
-
39
-
40
-
41
-
42
-
43
-
44
-
45
-
46
-
47
-
48
-
49
-
50
-
51
-
52
-
53
-
54
-
55
-
56
-
57
-
58
-
59
-
60
-
61
-
62
-
63
-
64
-
65
-
66
-
67
-
68
-
69
-
70
-
71
-
72
-
73
-
74
-
75
-
76
-
77
-
78
-
79
-
80
-
81
-
82
-
83
-
84
-
85
-
86
-
87
-
88
-
89
-
90
-
91
-
92
-
93
-
94
-
95
-
96
-
97
-
98
-
99
-
100
-
101
-
102
-
103
-
104
-
105
-
106
-
107
-
108
-
109
-
110
-
111
-
112
-
113
-
114
-
115
-
116
-
117
-
118
-
119
-
120
-
121
-
122
-
123
-
124
-
125
-
126
-
127
-
128
-
129
-
130
-
131
-
132
-
133
-
134
-
135
-
136
-
137
-
138
-
139
-
140
-
141
-
142
-
143
-
144
-
145
-
146
-
147
-
148
-
149
-
150
-
151
-
152
-
153
-
154
-
155
-
156
-
157
-
158
-
159
-
160
-
161
-
162
-
163
-
164
-
165
-
166
-
167
-
168
-
169
-
170
-
171
-
172
-
173
-
174
-
175
-
176
-
177
-
178
-
179
-
180
-
181
-
182
-
183
-
184
-
185
-
186
-
187
-
188
-
189
-
190
-
191
-
192
-
193
-
194
-
195
-
196
-
197
-
198
-
199
-
200
-
201
-
202
-
203
-
204
-
205
-
206
-
207
-
208
-
209
-
210
-
211
-
212
-
213
-
214
-
215
-
216
-
217
-
218
-
219
-
220
 |
 |
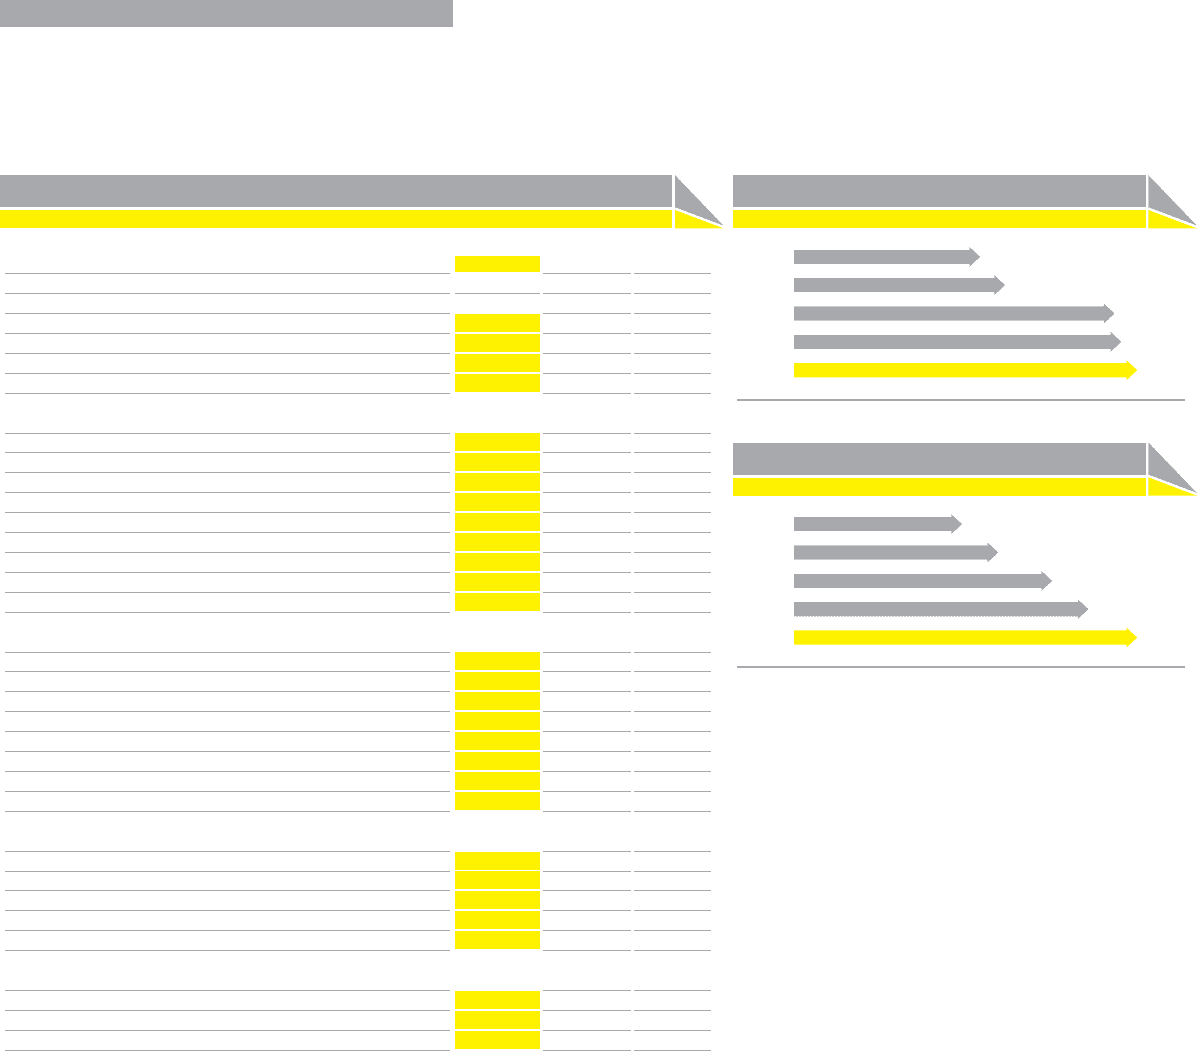
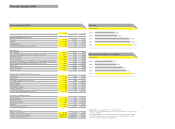
Financial highlights (IFRS)
2008 2007 Change
Operating highlights (€ in millions)
Net sales 10,799 10,299 4.9%
EBITDA 1,277 1,165 9.7%
Operating profi t 1,070 949 12.7%
Net income attributable to shareholders 642 551 16.4%
Key ratios (%)
Gross margin 48.7% 47.4% 1.3pp
Other operating expenses as a percentage of net sales 40.5% 40.0% 0.6pp
Operating margin 9.9% 9.2% 0.7pp
Effective tax rate 28.8% 31.8% (3.0pp)
Net income attributable to shareholders as a percentage of net sales 5.9% 5.4% 0.6pp
Operating working capital as a percentage of net sales 24.5% 25.2% (0.7pp)
Equity ratio 35.5% 36.3% (0.8pp)
Financial leverage 64.6% 58.4% 6.2pp
Return on equity 18.9% 18.2% 0.7pp
Balance sheet and cash fl ow data (€ in millions)
Total assets 9,533 8,325 14.5%
Inventories 1,995 1,629 22.5%
Receivables and other current assets 2,523 2,048 23.2%
Working capital 1,290 1,522 (15.3%)
Net borrowings 2,189 1,766 24.0%
Shareholders’ equity 3,386 3,023 12.0%
Capital expenditure 380 289 31.6%
Net cash provided by operating activities 497 780 (36.3%)
Per share of common stock (€)
Basic earnings 3.25 2.71 19.9%
Diluted earnings 3.07 2.57 19.6%
Operating cash fl ow 2.52 3.83 (34.3%)
Dividend 0.50 3) 0.50 0.0%
Share price at year-end 27.14 51.26 (47.1%)
Other (at year-end)
Number of employees 38,982 31,344 24.4%
Number of shares outstanding 193,515,512 203,628,960 (5.0%)
Average number of shares 197,562,346 203,594,975 (3.0%)
Financial Highlights 2008
Rounding differences may arise in percentages and totals.
1) Figures refl ect continuing operations as a result of the divestiture of the Salomon
business segment.
2) Including Reebok business segment from February 1, 2006 onwards. Including
Greg Norman apparel business from February 1, 2006 to November 30, 2006.
3) Subject to Annual General Meeting approval.
Net sales
€ in millions
2004 1) 5,860
2005 1) 6,636
2006 2) 10,084
2007 10,299
2008 10,799
Net income attributable to shareholders
€ in millions
2004 314
2005 383
2006 2) 483
2007 551
2008 642