Reebok 2008 Annual Report Download - page 90
Download and view the complete annual report
Please find page 90 of the 2008 Reebok annual report below. You can navigate through the pages in the report by either clicking on the pages listed below, or by using the keyword search tool below to find specific information within the annual report.-
 1
1 -
2
-
3
-
4
-
5
-
6
-
7
-
8
-
9
-
10
-
11
-
12
-
13
-
14
-
15
-
16
-
17
-
18
-
19
-
20
-
21
-
22
-
23
-
24
-
25
-
26
-
27
-
28
-
29
-
30
-
31
-
32
-
33
-
34
-
35
-
36
-
37
-
38
-
39
-
40
-
41
-
42
-
43
-
44
-
45
-
46
-
47
-
48
-
49
-
50
-
51
-
52
-
53
-
54
-
55
-
56
-
57
-
58
-
59
-
60
-
61
-
62
-
63
-
64
-
65
-
66
-
67
-
68
-
69
-
70
-
71
-
72
-
73
-
74
-
75
-
76
-
77
-
78
-
79
-
 80
80 -
 81
81 -
 82
82 -
 83
83 -
 84
84 -
 85
85 -
 86
86 -
 87
87 -
 88
88 -
 89
89 -
 90
90 -
 91
91 -
 92
92 -
 93
93 -
 94
94 -
 95
95 -
 96
96 -
 97
97 -
 98
98 -
 99
99 -
 100
100 -
101
-
102
-
103
-
104
-
105
-
106
-
107
-
108
-
109
-
110
-
111
-
112
-
113
-
114
-
115
-
116
-
117
-
118
-
119
-
120
-
121
-
122
-
123
-
124
-
125
-
126
-
127
-
128
-
129
-
130
-
131
-
132
-
133
-
134
-
135
-
136
-
137
-
138
-
139
-
140
-
141
-
142
-
143
-
144
-
145
-
146
-
147
-
148
-
149
-
150
-
151
-
152
-
153
-
154
-
155
-
156
-
157
-
158
-
159
-
160
-
161
-
162
-
163
-
164
-
165
-
166
-
167
-
168
-
169
-
170
-
171
-
172
-
173
-
174
-
175
-
176
-
177
-
178
-
179
-
180
-
181
-
182
-
183
-
184
-
185
-
186
-
187
-
188
-
189
-
190
-
191
-
192
-
193
-
194
-
195
-
196
-
197
-
198
-
199
-
200
-
201
-
202
-
203
-
204
-
205
-
206
-
207
-
208
-
209
-
210
-
211
-
212
-
213
-
214
-
215
-
216
-
217
-
218
-
219
-
220
 |
 |

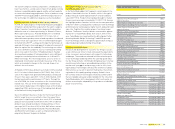
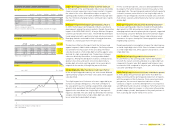
086 Group Management Report – Our Financial Year Group Business Performance — Income Statement
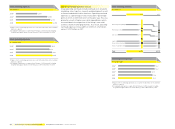
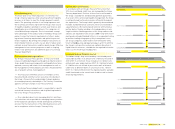
Other operating expenses
€ in millions
2005 1) 2,573
2006 2) 3,759
2007 4,115
2008 4,378
1) Figure refl ects continuing operations as a result of the divestiture of the Salomon
business segment.
2) Including Reebok business segment from February 1, 2006 onwards. Including
Greg Norman apparel business from February 1, 2006 to November 30, 2006.
Other operating expenses
in % of net sales
2005 1) 38.8
2006 2) 37.3
2007 40.0
2008 40.5
1) Figure refl ects continuing operations as a result of the divestiture of the Salomon
business segment.
2) Including Reebok business segment from February 1, 2006 onwards. Including
Greg Norman apparel business from February 1, 2006 to November 30, 2006.
Marketing working budget
in % of net sales
2004 1) 14.2
2005 1) 14.2
2006 2) 12.9
2007 13.4
2008 13.2
1) Figures refl ect continuing operations as a result of the divestiture of the Salomon
business segment.
2) Including Reebok business segment from February 1, 2006 onwards. Including
Greg Norman apparel business from February 1, 2006 to November 30, 2006.
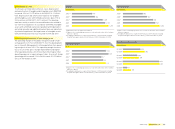
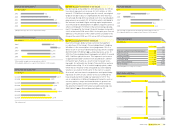
Other operating expenses
€ in millions
2008 2007
Total 4,378 4,115
Finance & administration 748
Research & development 81
Logistics 565
Sales force 1,179
Marketing overhead 376
Marketing working budget 1,429
746
84
535
1,045
327
1,378
Operating overhead expenses increase
Group operating overheads include overhead costs related to
marketing, sales, logistics, research and development as well
as fi nance and administration functions. Operating overhead
expenses as a percentage of sales increased 0.7 percentage
points to 27.3% in 2008 from 26.6% in the prior year. This was
primarily a result of higher own-retail expenditures, which
increased due to the expansion of the Group’s own-retail
activities, mainly in emerging markets. As a result, operating
overhead expenses increased 8% in 2008 to € 2.949 billion
versus € 2.737 billion in 2007.