Reebok 2008 Annual Report Download - page 64
Download and view the complete annual report
Please find page 64 of the 2008 Reebok annual report below. You can navigate through the pages in the report by either clicking on the pages listed below, or by using the keyword search tool below to find specific information within the annual report.-
 1
1 -
2
-
3
-
4
-
5
-
6
-
7
-
8
-
9
-
10
-
11
-
12
-
13
-
14
-
15
-
16
-
17
-
18
-
19
-
20
-
21
-
22
-
23
-
24
-
25
-
26
-
27
-
28
-
29
-
30
-
31
-
32
-
33
-
34
-
35
-
36
-
37
-
38
-
39
-
40
-
41
-
42
-
43
-
44
-
45
-
46
-
47
-
48
-
49
-
50
-
51
-
52
-
53
-
 54
54 -
 55
55 -
 56
56 -
 57
57 -
 58
58 -
 59
59 -
 60
60 -
 61
61 -
 62
62 -
 63
63 -
 64
64 -
 65
65 -
 66
66 -
 67
67 -
 68
68 -
 69
69 -
 70
70 -
 71
71 -
 72
72 -
 73
73 -
 74
74 -
75
-
76
-
77
-
78
-
79
-
80
-
81
-
82
-
83
-
84
-
85
-
86
-
87
-
88
-
89
-
90
-
91
-
92
-
93
-
94
-
95
-
96
-
97
-
98
-
99
-
100
-
101
-
102
-
103
-
104
-
105
-
106
-
107
-
108
-
109
-
110
-
111
-
112
-
113
-
114
-
115
-
116
-
117
-
118
-
119
-
120
-
121
-
122
-
123
-
124
-
125
-
126
-
127
-
128
-
129
-
130
-
131
-
132
-
133
-
134
-
135
-
136
-
137
-
138
-
139
-
140
-
141
-
142
-
143
-
144
-
145
-
146
-
147
-
148
-
149
-
150
-
151
-
152
-
153
-
154
-
155
-
156
-
157
-
158
-
159
-
160
-
161
-
162
-
163
-
164
-
165
-
166
-
167
-
168
-
169
-
170
-
171
-
172
-
173
-
174
-
175
-
176
-
177
-
178
-
179
-
180
-
181
-
182
-
183
-
184
-
185
-
186
-
187
-
188
-
189
-
190
-
191
-
192
-
193
-
194
-
195
-
196
-
197
-
198
-
199
-
200
-
201
-
202
-
203
-
204
-
205
-
206
-
207
-
208
-
209
-
210
-
211
-
212
-
213
-
214
-
215
-
216
-
217
-
218
-
219
-
220
 |
 |

060 Group Management Report – Our Group Structure and Strategy — Internal Group Management System
Capital expenditure targeted to maximise future returns
Improving the effectiveness of the Group’s capital expenditure
is another lever to maximise the Group’s free cash fl ow. Our
capital expenditure is controlled with a top-down, bottom-up
approach: In a fi rst step, Group Management defi nes focus
areas and an overall investment budget based on investment
requests by brand management. Our operating units then
align their initiatives within the scope of assigned priorities
and available budget. We evaluate potential return on planned
investments utilising the net present value. Risk is accounted
for, adding a risk premium to the cost of capital and decreasing
future revenue streams where appropriate. By means of sce-
nario planning, the sensitivity of investment returns is tested
against changes in initial assumptions. For large investment
projects, timelines and deviations versus budget are monitored
on a monthly basis throughout the course of the project.
M & A activities focus on long-term value creation potential
We see the majority of our Group’s future growth opportuni-
ties in our
organic business. However, as part of our com-
mitment to ensuring sustainable profi table development we
regularly
review merger and acquisition options that may
provide additional commercial and operational opportunities.
Acquisitive growth focus is primarily related to improving our
Group’s positioning within a sports category, strengthening our
technology portfolio or addressing new consumer segments.
The strate
gies and business culture of any potential acquisi-
tion candidate must correspond with the Group’s direction and
culture. Maximising return on invested capital above the cost of
capital is a core consideration in our decision-making process.
Of particular importance is evaluating the potential impact on
our Group’s free cash fl ow. We assess current and future pro-
jected key fi nancial metrics to evaluate a target’s contribution
potential. In addition, careful consideration is given to potential
fi nancing needs and their impact on the Group’s fi nancial
leverage.
Cost of capital metric used to measure investment potential
Creating value for our shareholders by earning a return on
invested capital above the cost of that capital is a guiding
principle of our Group strategy. We source capital from equity
and debt markets. Therefore, we have a responsibility that our
return on capital meets the expectations of both equity share-
holders and creditors. Our Group calculates the cost of capital
utilising the weighted average cost of capital (WACC) formula.
This metric allows us to calculate the minimum required fi nan-
cial returns of planned capital investments. The cost of equity
is computed utilising the risk-free rate, market risk premium
and beta. Cost of debt is calculated using the risk-free rate,
credit spread and average tax rate.
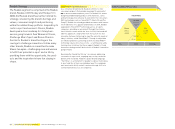
Structured performance measurement system
Our Group has developed an extensive performance measure-
ment system, which utilises a variety of tools to measure the
performance of the adidas Group and our brand segments.
The Group’s key fi nancial metrics are monitored and com-
pared against budget on a monthly basis. Focus is on free cash
fl ow, sales, operating margin and operating working capital
development. When negative deviations exist between actual
and target numbers, we perform a detailed analysis to identify
and address the cause. We also benchmark our Group’s and
brands’ fi nancial results with those of our major competi
tors
on a quarterly basis.
To assess current sales and profi tability
development, Management analyses sell-through informa-
tion from our controlled space distribution as well as short-
term replenishment orders from retailers. Taking into account
year-to-date performance as well as opportunities and risks,
the Group’s full year fi nancial performance is forecasted on a
quarterly basis. In this respect, backlogs comprising orders
received up to nine months in advance of the actual sale are
used as an indicator. However, due to the growing share of own
retail in our business mix as well as fl uctuating order patterns
among retailers, our brands’ order books are less indicative
of anticipated revenues compared to the past. As a result of
the growing share of at-once business, qualitative feedback
from our retail partners on the success of our collections at
the point-of-sale is becoming even more important. As an
early indicator for future performance, we also conduct market
research to measure brand appeal, brand awareness and
resulting purchase intent.