Reebok 2008 Annual Report Download - page 86
Download and view the complete annual report
Please find page 86 of the 2008 Reebok annual report below. You can navigate through the pages in the report by either clicking on the pages listed below, or by using the keyword search tool below to find specific information within the annual report.-
 1
1 -
2
-
3
-
4
-
5
-
6
-
7
-
8
-
9
-
10
-
11
-
12
-
13
-
14
-
15
-
16
-
17
-
18
-
19
-
20
-
21
-
22
-
23
-
24
-
25
-
26
-
27
-
28
-
29
-
30
-
31
-
32
-
33
-
34
-
35
-
36
-
37
-
38
-
39
-
40
-
41
-
42
-
43
-
44
-
45
-
46
-
47
-
48
-
49
-
50
-
51
-
52
-
53
-
54
-
55
-
56
-
57
-
58
-
59
-
60
-
61
-
62
-
63
-
64
-
65
-
66
-
67
-
68
-
69
-
70
-
71
-
72
-
73
-
74
-
75
-
 76
76 -
 77
77 -
 78
78 -
 79
79 -
 80
80 -
 81
81 -
 82
82 -
 83
83 -
 84
84 -
 85
85 -
 86
86 -
 87
87 -
 88
88 -
 89
89 -
 90
90 -
 91
91 -
 92
92 -
 93
93 -
 94
94 -
 95
95 -
 96
96 -
97
-
98
-
99
-
100
-
101
-
102
-
103
-
104
-
105
-
106
-
107
-
108
-
109
-
110
-
111
-
112
-
113
-
114
-
115
-
116
-
117
-
118
-
119
-
120
-
121
-
122
-
123
-
124
-
125
-
126
-
127
-
128
-
129
-
130
-
131
-
132
-
133
-
134
-
135
-
136
-
137
-
138
-
139
-
140
-
141
-
142
-
143
-
144
-
145
-
146
-
147
-
148
-
149
-
150
-
151
-
152
-
153
-
154
-
155
-
156
-
157
-
158
-
159
-
160
-
161
-
162
-
163
-
164
-
165
-
166
-
167
-
168
-
169
-
170
-
171
-
172
-
173
-
174
-
175
-
176
-
177
-
178
-
179
-
180
-
181
-
182
-
183
-
184
-
185
-
186
-
187
-
188
-
189
-
190
-
191
-
192
-
193
-
194
-
195
-
196
-
197
-
198
-
199
-
200
-
201
-
202
-
203
-
204
-
205
-
206
-
207
-
208
-
209
-
210
-
211
-
212
-
213
-
214
-
215
-
216
-
217
-
218
-
219
-
220
 |
 |

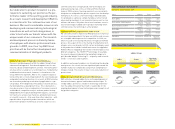
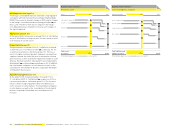
082 Group Management Report – Our Financial Year Group Business Performance — Income Statement
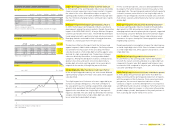
Net sales
€ in millions
2004 1) 5,860
2005 1) 6,636
2006 2) 10,084
2007 10,299
2008 10,799
1) Figures refl ect continuing operations as a result of the divestiture of the Salomon
business segment.
2) Including Reebok business segment from February 1, 2006 onwards. Including
Greg Norman apparel business from February 1, 2006 to November 30, 2006.
Net sales by quarter
€ in millions
Q1 2007
Q1 2008
2,538
2,621
Q2 2007
Q2 2008
2,400
2,521
Q3 2007
Q3 2008
2,941
3,083
Q4 2007
Q4 2008
2,419
2,574
Income Statement
No change in accounting policy
The Group’s consolidated fi nancial statements are prepared in
accordance with International Financial Reporting Standards
(IFRS). There were no relevant changes in IFRS and no changes
in the Group’s consolidation and accounting principles see
Note 1, p. 157. Therefore, there was no impact on the Group’s
consolidated fi nancial statements from any such changes in
the reporting period.
Portfolio changes impact business development
In 2008, the adidas Group implemented various portfolio
changes which had an impact on the Group’s fi nancial results
see Note 4, p. 164. In February 2008, TaylorMade-adidas Golf
divested the Maxfl i brand. This had a small negative impact
on sales. The Group’s operating result was positively impacted
by a one-time book gain of € 5 million resulting from this
transaction. In addition, in November 2008, the TaylorMade-
adidas Golf segment acquired Ashworth, Inc., a leader in cotton
casual golf apparel. The Ashworth consolidation did not have
a signifi cant impact on the Group’s sales in 2008. The trans-
action positively impacted the Group’s operating result due to a
one-time book gain of € 21 million. However, this was partially
offset by restructuring costs and other one-time expenses of
€ 7 million. Furthermore, effective April 1, 2008, the adidas
Group acquired 99.99% of the shares of Reebok Productos
Esportivos Brasil Ltda. (formerly Comercial Vulcabras Ltda.),
the distributor for Reebok products in Brazil and Paraguay.
Effective June 2, 2008, Reebok also founded a new company
in Argentina, in which the adidas Group holds 99.99% of the
shares. Both these transactions had a positive impact on sales
in the Reebok segment. Royalty income, however, was nega-
tively impacted as the new com panies took over the business
of the former distribution partner in the region.
Synergies support operational performance
The operational performance of the adidas and Reebok seg-
ments was positively impacted by the realisation of revenue
and cost synergies resulting from the integration of the
Reebok business into the adidas Group. Sales synergies were
realised in the Reebok segment, in particular in countries for
which Reebok had purchased the distribution rights, such as
Russia and China. Revenue synergies also had a small positive
impact on sales development in the adidas segment due to
increased revenues related to the NBA licence business, which
was transferred from Reebok to the adidas brand in 2006. Cost
synergies resulting from the combination of adidas and Reebok
sourcing activities also continued to have a positive impact on
the cost of sales. These were partly offset by integration costs
which negatively impacted the Group’s operating expenses.
In 2008, we realised revenue synergies of around € 230 mil-
lion (2007: around € 100 million). Due to lower than expected
Reebok apparel sales, these synergies are slightly below our
initial expectations. Net cost synergies were in line with expec-
tations and amounted to around € 110 million for the full year
2008 (2007: around € 20 million).
adidas Group currency-neutral sales grow 9%
In 2008, Group revenues increased 9% on a currency-neutral
basis, as a result of strong sales growth in the adidas and
TaylorMade-adidas Golf segments. This development was in
line with initial Management expectations of high-single-digit
growth. Currency translation effects negatively impacted Group
sales in euro terms. Group revenues grew 5% in euro terms to
€ 10.799 billion in 2008 from € 10.299 billion in 2007.