Reebok 2008 Annual Report Download - page 110
Download and view the complete annual report
Please find page 110 of the 2008 Reebok annual report below. You can navigate through the pages in the report by either clicking on the pages listed below, or by using the keyword search tool below to find specific information within the annual report.-
 1
1 -
2
-
3
-
4
-
5
-
6
-
7
-
8
-
9
-
10
-
11
-
12
-
13
-
14
-
15
-
16
-
17
-
18
-
19
-
20
-
21
-
22
-
23
-
24
-
25
-
26
-
27
-
28
-
29
-
30
-
31
-
32
-
33
-
34
-
35
-
36
-
37
-
38
-
39
-
40
-
41
-
42
-
43
-
44
-
45
-
46
-
47
-
48
-
49
-
50
-
51
-
52
-
53
-
54
-
55
-
56
-
57
-
58
-
59
-
60
-
61
-
62
-
63
-
64
-
65
-
66
-
67
-
68
-
69
-
70
-
71
-
72
-
73
-
74
-
75
-
76
-
77
-
78
-
79
-
80
-
81
-
82
-
83
-
84
-
85
-
86
-
87
-
88
-
89
-
90
-
91
-
92
-
93
-
94
-
95
-
96
-
97
-
98
-
99
-
 100
100 -
 101
101 -
 102
102 -
 103
103 -
 104
104 -
 105
105 -
 106
106 -
 107
107 -
 108
108 -
 109
109 -
 110
110 -
 111
111 -
 112
112 -
 113
113 -
 114
114 -
 115
115 -
 116
116 -
 117
117 -
 118
118 -
 119
119 -
 120
120 -
121
-
122
-
123
-
124
-
125
-
126
-
127
-
128
-
129
-
130
-
131
-
132
-
133
-
134
-
135
-
136
-
137
-
138
-
139
-
140
-
141
-
142
-
143
-
144
-
145
-
146
-
147
-
148
-
149
-
150
-
151
-
152
-
153
-
154
-
155
-
156
-
157
-
158
-
159
-
160
-
161
-
162
-
163
-
164
-
165
-
166
-
167
-
168
-
169
-
170
-
171
-
172
-
173
-
174
-
175
-
176
-
177
-
178
-
179
-
180
-
181
-
182
-
183
-
184
-
185
-
186
-
187
-
188
-
189
-
190
-
191
-
192
-
193
-
194
-
195
-
196
-
197
-
198
-
199
-
200
-
201
-
202
-
203
-
204
-
205
-
206
-
207
-
208
-
209
-
210
-
211
-
212
-
213
-
214
-
215
-
216
-
217
-
218
-
219
-
220
 |
 |

106 Group Management Report – Our Financial Year Business Performance by Segment — TaylorMade-adidas Golf Business Performance — Risk and Opportunity Report
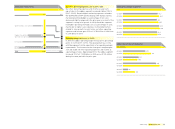
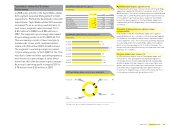
2008 TaylorMade-adidas Golf net sales by region
North America 50% Latin America 1%
Europe 12%
Asia 37%
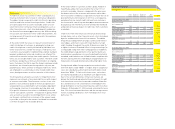
TaylorMade-adidas Golf gross margin by quarter
in %
Q1 2007
Q1 2008
43.9
46.6
Q2 2007
Q2 2008
44.7
46.4
Q3 2007
Q3 2008
44.3
42.9
Q4 2007
Q4 2008
46.0
41.0
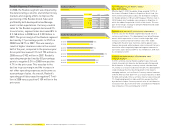
TaylorMade-adidas Golf operating profi t by quarter
€ in millions
Q1 2007
Q1 2008
(1)
23
Q2 2007
Q2 2008
27
19
Q3 2007
Q3 2008
15
11
Q4 2007
Q4 2008
24
24
Currency-neutral revenues grow at double-digit
rates in almost all regions
TaylorMade-adidas Golf currency-neutral sales grew in all
regions in 2008. Sales in Europe increased 17% on a currency-
neutral basis, driven by double-digit growth in all major coun-
tries, in particular in the UK. In North America, sales increased
3% on a currency-neutral basis, due to growth in both the USA
and Canada. TaylorMade-adidas Golf sales in Asia increased
10% on a currency-neutral basis, driven by double-digit growth
in Japan, China and South Korea. In Latin America, currency-
neutral sales grew 38%, driven by double-digit growth in all
major countries.
Currency translation effects negatively impacted segment rev-
enues in euro terms. In euro terms, sales in Europe remained
stable at € 95 million (2007: € 95 million). Revenues in North
America decreased 4% to € 405 million in 2008 from € 422 mil-
lion in 2007. In Asia, sales grew 8% to € 305 million in 2008
(2007: € 282 million), and in Latin America revenues increased
28% to € 7 million in 2008 (2007: € 6 million).
Gross margin decreases to 44.3%
TaylorMade-adidas Golf gross margin decreased 0.5 percent-
age points to 44.3% in 2008 (2007: 44.7%). This development
was below Management’s initial expectation of a gross margin
improvement. The decrease was mainly due to lower metal-
wood margins as a result of the promotional environment
in this category, in particular in the second half of the year.
However, this was partly offset by a strong increase in golf ball
margins. Gross profi t remained almost stable at € 359 million
(2007: € 360 million).
Royalty and commission expenses increase 13%
Royalty and commission expenses at TaylorMade-adidas Golf
increased 13% to € 20 million in 2008 (2007: € 18 million). This
development was driven by higher adidas Golf sales, which
generated higher intra-Group royalties paid to the adidas
segment.
Net other operating expenses and income decrease
Net other operating expenses and income as a percentage of
sales at TaylorMade-adidas Golf decreased 2.3 percentage
points to 32.1% in 2008 from 34.4% in 2007. This improvement
was mainly due to one-time book gains of € 21 million from
the acquisition of Ashworth and € 5 million from the divestiture
of the Maxfl i business. In absolute terms, net other operating
expenses and income decreased 6% to € 261 million in 2008
from € 277 million in 2007.
Operating margin expands by 1.5 percentage points
The TaylorMade-adidas Golf operating margin increased
1.5 percentage points to 9.6% in 2008 from 8.1% in 2007. This
development was in line with Management’s initial expectation
of an operating margin improvement. This is mainly a result
of lower net other operating expenses and income as a per-
centage of sales which more than compensated for the gross
margin decline. Consequently, operating profi t for TaylorMade-
adidas Golf increased 20% to € 78 million in 2008 versus
€ 65 million in 2007.