Reebok 2008 Annual Report Download - page 93
Download and view the complete annual report
Please find page 93 of the 2008 Reebok annual report below. You can navigate through the pages in the report by either clicking on the pages listed below, or by using the keyword search tool below to find specific information within the annual report.-
 1
1 -
2
-
3
-
4
-
5
-
6
-
7
-
8
-
9
-
10
-
11
-
12
-
13
-
14
-
15
-
16
-
17
-
18
-
19
-
20
-
21
-
22
-
23
-
24
-
25
-
26
-
27
-
28
-
29
-
30
-
31
-
32
-
33
-
34
-
35
-
36
-
37
-
38
-
39
-
40
-
41
-
42
-
43
-
44
-
45
-
46
-
47
-
48
-
49
-
50
-
51
-
52
-
53
-
54
-
55
-
56
-
57
-
58
-
59
-
60
-
61
-
62
-
63
-
64
-
65
-
66
-
67
-
68
-
69
-
70
-
71
-
72
-
73
-
74
-
75
-
76
-
77
-
78
-
79
-
80
-
81
-
82
-
 83
83 -
 84
84 -
 85
85 -
 86
86 -
 87
87 -
 88
88 -
 89
89 -
 90
90 -
 91
91 -
 92
92 -
 93
93 -
 94
94 -
 95
95 -
 96
96 -
 97
97 -
 98
98 -
 99
99 -
 100
100 -
 101
101 -
 102
102 -
 103
103 -
104
-
105
-
106
-
107
-
108
-
109
-
110
-
111
-
112
-
113
-
114
-
115
-
116
-
117
-
118
-
119
-
120
-
121
-
122
-
123
-
124
-
125
-
126
-
127
-
128
-
129
-
130
-
131
-
132
-
133
-
134
-
135
-
136
-
137
-
138
-
139
-
140
-
141
-
142
-
143
-
144
-
145
-
146
-
147
-
148
-
149
-
150
-
151
-
152
-
153
-
154
-
155
-
156
-
157
-
158
-
159
-
160
-
161
-
162
-
163
-
164
-
165
-
166
-
167
-
168
-
169
-
170
-
171
-
172
-
173
-
174
-
175
-
176
-
177
-
178
-
179
-
180
-
181
-
182
-
183
-
184
-
185
-
186
-
187
-
188
-
189
-
190
-
191
-
192
-
193
-
194
-
195
-
196
-
197
-
198
-
199
-
200
-
201
-
202
-
203
-
204
-
205
-
206
-
207
-
208
-
209
-
210
-
211
-
212
-
213
-
214
-
215
-
216
-
217
-
218
-
219
-
220
 |
 |

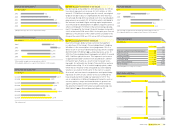
adidas Group Annual Report 2008 089
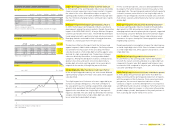
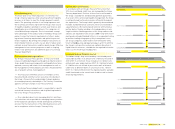
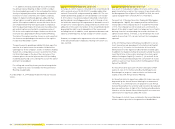
Net income attributable to shareholders
€ in millions
2004 314
2005 383
2006 1) 483
2007 551
2008 642
1) Including Reebok business segment from February 1, 2006 onwards. Including
Greg Norman apparel business from February 1, 2006 to November 30, 2006.
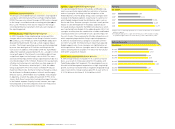
Net income attributable to shareholders by quarter
€ in millions
Q1 2007
Q1 2008
128
169
Q2 2007
Q2 2008
104
116
Q3 2007
Q3 2008
298
302
Q4 2007
Q4 2008
21
54
Net income attributable to shareholders grows 16%
The Group’s net income attributable to shareholders increased
16% to € 642 million in 2008 from € 551 million in 2007. This
development was in line with Management’s initial expectation
of net income growth of at least 15%. The Group’s higher oper-
ating profi t, a lower tax rate and lower minority interests con-
tributed to this development. The Group’s tax rate decreased
3.0 percentage points to 28.8% in 2008 (2007: 31.8%) mainly
due to a more favourable regional earnings mix throughout the
Group as well as one-time tax benefi ts in the fourth quarter of
2008 see Note 28, p. 189.
Minority interests decline 39%
The Group’s minority interests decreased 39% to € 2 million in
2008 from € 4 million in 2007. The decline was primarily due to
lower profi t at Reebok’s subsidiary in Spain.
Basic and diluted earnings per share increase 20%
Basic earnings per share increased 20% to € 3.25 in 2008
versus € 2.71 in 2007. Basic earnings per share increased
at a higher rate than the Group’s net income attributable
to shareholders due to a decrease in the number of shares
outstanding. The weighted average number of shares used
in the calculation of basic earnings per share decreased
to 197,562,346 in 2008 (2007 average: 203,594,975) due to
the share buyback programme initiated in January 2008
see Our Share, p. 038. Diluted earnings per share in 2008
increased 20% to € 3.07 from € 2.57 in the prior year. The
weighted average number of shares used in the calculation
of diluted earnings per share was 213,333,203 (2007 average:
219,467,177). The dilutive effect largely results from approxi-
mately sixteen million additional potential shares that could
be created in relation to our outstanding convertible bond,
for which conversion criteria were fi rst met at the end of the
fourth quarter of 2004.