Reebok 2008 Annual Report Download - page 91
Download and view the complete annual report
Please find page 91 of the 2008 Reebok annual report below. You can navigate through the pages in the report by either clicking on the pages listed below, or by using the keyword search tool below to find specific information within the annual report.-
 1
1 -
2
-
3
-
4
-
5
-
6
-
7
-
8
-
9
-
10
-
11
-
12
-
13
-
14
-
15
-
16
-
17
-
18
-
19
-
20
-
21
-
22
-
23
-
24
-
25
-
26
-
27
-
28
-
29
-
30
-
31
-
32
-
33
-
34
-
35
-
36
-
37
-
38
-
39
-
40
-
41
-
42
-
43
-
44
-
45
-
46
-
47
-
48
-
49
-
50
-
51
-
52
-
53
-
54
-
55
-
56
-
57
-
58
-
59
-
60
-
61
-
62
-
63
-
64
-
65
-
66
-
67
-
68
-
69
-
70
-
71
-
72
-
73
-
74
-
75
-
76
-
77
-
78
-
79
-
80
-
 81
81 -
 82
82 -
 83
83 -
 84
84 -
 85
85 -
 86
86 -
 87
87 -
 88
88 -
 89
89 -
 90
90 -
 91
91 -
 92
92 -
 93
93 -
 94
94 -
 95
95 -
 96
96 -
 97
97 -
 98
98 -
 99
99 -
 100
100 -
 101
101 -
102
-
103
-
104
-
105
-
106
-
107
-
108
-
109
-
110
-
111
-
112
-
113
-
114
-
115
-
116
-
117
-
118
-
119
-
120
-
121
-
122
-
123
-
124
-
125
-
126
-
127
-
128
-
129
-
130
-
131
-
132
-
133
-
134
-
135
-
136
-
137
-
138
-
139
-
140
-
141
-
142
-
143
-
144
-
145
-
146
-
147
-
148
-
149
-
150
-
151
-
152
-
153
-
154
-
155
-
156
-
157
-
158
-
159
-
160
-
161
-
162
-
163
-
164
-
165
-
166
-
167
-
168
-
169
-
170
-
171
-
172
-
173
-
174
-
175
-
176
-
177
-
178
-
179
-
180
-
181
-
182
-
183
-
184
-
185
-
186
-
187
-
188
-
189
-
190
-
191
-
192
-
193
-
194
-
195
-
196
-
197
-
198
-
199
-
200
-
201
-
202
-
203
-
204
-
205
-
206
-
207
-
208
-
209
-
210
-
211
-
212
-
213
-
214
-
215
-
216
-
217
-
218
-
219
-
220
 |
 |

adidas Group Annual Report 2008 087
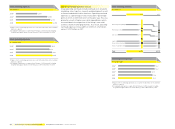
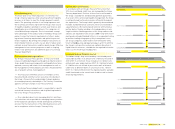
EBITDA
€ in millions
2004 1) 2) 716
2005 2) 806
2006 3) 1,078
2007 1,165
2008 1,277
1) Adjusted to refl ect the application of IAS 32.
2) Figures refl ect continuing operations as a result of the divestiture of the Salomon
business segment.
3) Including Reebok business segment from February 1, 2006 onwards. Including
Greg Norman apparel business from February 1, 2006 to November 30, 2006.
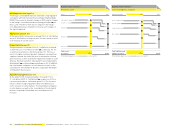
Operating margin
in %
2004 1) 10.0
2005 1) 10.7
2006 2) 8.7
2007 9.2
2008 9.9
1) Figures refl ect continuing operations as a result of the divestiture of the Salomon
business segment.
2) Including Reebok business segment from February 1, 2006 onwards. Including
Greg Norman apparel business from February 1, 2006 to November 30, 2006.
Operating profi t
€ in millions
2004 1) 584
2005 1) 707
2006 2) 881
2007 949
2008 1,070
1) Figures refl ect continuing operations as a result of the divestiture of the Salomon
business segment.
2) Including Reebok business segment from February 1, 2006 onwards. Including
Greg Norman apparel business from February 1, 2006 to November 30, 2006.
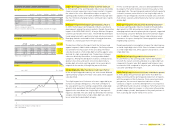
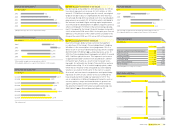
Operating profi t by quarter
€ in millions
Q1 2007
Q1 2008
229
282
Q2 2007
Q2 2008
188
208
Q3 2007
Q3 2008
471
473
Q4 2007
Q4 2008
61
107
EBITDA increases 10%
The Group’s earnings before interest, taxes, depreciation
and amortisation of tangible and intangible assets (EBITDA)
increased 10% to € 1.277 billion in 2008 (2007: € 1.165 bil-
lion). Depreciation and amortisation expense for tangible
and intangible assets with limited useful lives grew 11% to
€ 234 million in 2008 (2007: € 211 million). This develop-
ment was mainly a result of increased fi xed assets related to
our own-retail expansion. In accordance with IFRS, intangible
assets with unlimited useful lives (goodwill and trademarks)
are tested annually and additionally when there are indications
of potential impairment. No impairment of intangible assets
with unlimited useful lives was incurred in 2008 and 2007.
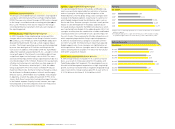
Operating margin improves 0.7 percentage points
The operating margin of the adidas Group increased 0.7 per-
centage points to 9.9% in 2008 (2007: 9.2%). This development
was in line with Management’s initial expectation of an operat-
ing margin of at least 9.5%. The operating margin increase
was a result of the gross margin improvement and higher
other operating income, which more than offset higher other
operating expenses as a percentage of sales. As a result, Group
operating profi t increased 13% in 2008 to reach € 1.070 billion
versus € 949 million in 2007.