Reebok 2008 Annual Report Download - page 105
Download and view the complete annual report
Please find page 105 of the 2008 Reebok annual report below. You can navigate through the pages in the report by either clicking on the pages listed below, or by using the keyword search tool below to find specific information within the annual report.-
 1
1 -
2
-
3
-
4
-
5
-
6
-
7
-
8
-
9
-
10
-
11
-
12
-
13
-
14
-
15
-
16
-
17
-
18
-
19
-
20
-
21
-
22
-
23
-
24
-
25
-
26
-
27
-
28
-
29
-
30
-
31
-
32
-
33
-
34
-
35
-
36
-
37
-
38
-
39
-
40
-
41
-
42
-
43
-
44
-
45
-
46
-
47
-
48
-
49
-
50
-
51
-
52
-
53
-
54
-
55
-
56
-
57
-
58
-
59
-
60
-
61
-
62
-
63
-
64
-
65
-
66
-
67
-
68
-
69
-
70
-
71
-
72
-
73
-
74
-
75
-
76
-
77
-
78
-
79
-
80
-
81
-
82
-
83
-
84
-
85
-
86
-
87
-
88
-
89
-
90
-
91
-
92
-
93
-
94
-
 95
95 -
 96
96 -
 97
97 -
 98
98 -
 99
99 -
 100
100 -
 101
101 -
 102
102 -
 103
103 -
 104
104 -
 105
105 -
 106
106 -
 107
107 -
 108
108 -
 109
109 -
 110
110 -
 111
111 -
 112
112 -
 113
113 -
 114
114 -
 115
115 -
116
-
117
-
118
-
119
-
120
-
121
-
122
-
123
-
124
-
125
-
126
-
127
-
128
-
129
-
130
-
131
-
132
-
133
-
134
-
135
-
136
-
137
-
138
-
139
-
140
-
141
-
142
-
143
-
144
-
145
-
146
-
147
-
148
-
149
-
150
-
151
-
152
-
153
-
154
-
155
-
156
-
157
-
158
-
159
-
160
-
161
-
162
-
163
-
164
-
165
-
166
-
167
-
168
-
169
-
170
-
171
-
172
-
173
-
174
-
175
-
176
-
177
-
178
-
179
-
180
-
181
-
182
-
183
-
184
-
185
-
186
-
187
-
188
-
189
-
190
-
191
-
192
-
193
-
194
-
195
-
196
-
197
-
198
-
199
-
200
-
201
-
202
-
203
-
204
-
205
-
206
-
207
-
208
-
209
-
210
-
211
-
212
-
213
-
214
-
215
-
216
-
217
-
218
-
219
-
220
 |
 |
adidas Group Annual Report 2008 101
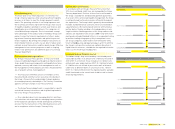
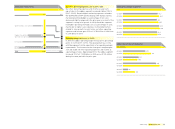
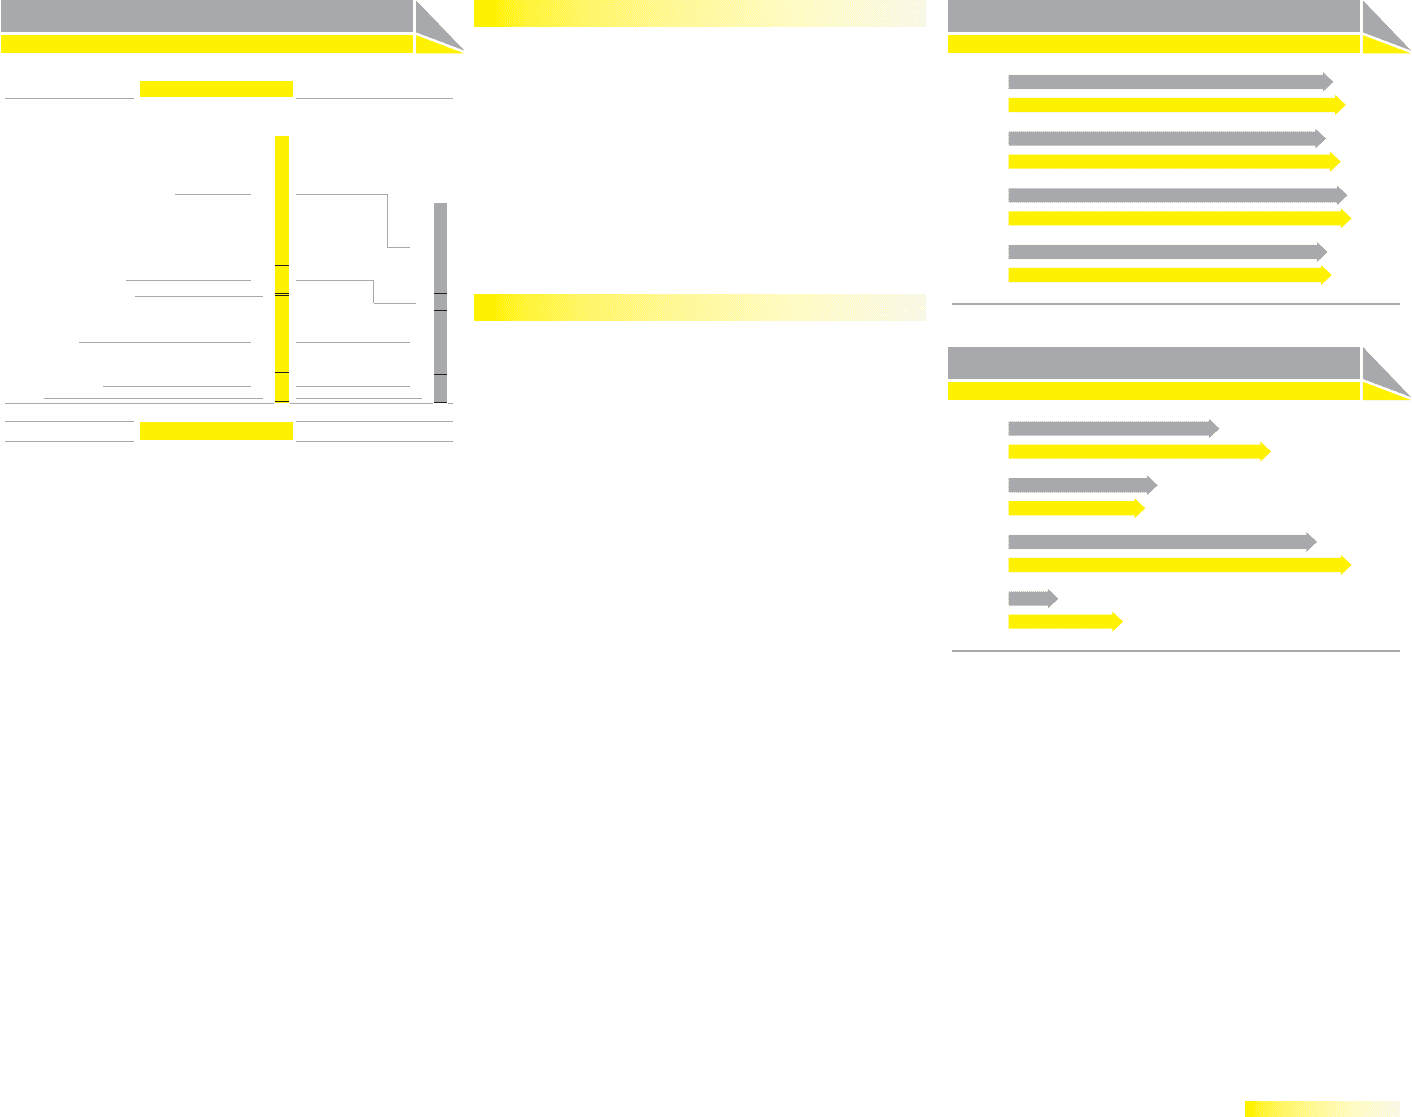
adidas gross margin by quarter
in %
Q1 2007
Q1 2008
47.2
49.0
Q2 2007
Q2 2008
46.1
48.3
Q3 2007
Q3 2008
49.3
49.8
Q4 2007
Q4 2008
46.4
47.0
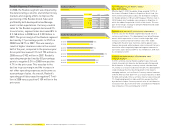
adidas operating profi t by quarter
€ in millions
Q1 2007
Q1 2008
270
336
Q2 2007
Q2 2008
191
175
Q3 2007
Q3 2008
395
439
Q4 2007
Q4 2008
64
147
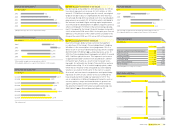
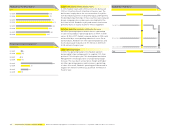
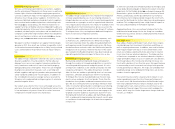
adidas own-retail stores
2008 2007
Total 1,332 1,003
Internet 5
Concession Corners 150
Factory Outlets 381
Sport Style Concept Stores 4
Originals Concept Stores 140
Sport Performance Concept Stores 652
2
142
317
83
459
Net other operating expenses and income stable
Net other operating expenses and income as a percent-
age of sales in the adidas segment remained stable at 35.6%
(2007: 35.6%). Despite higher marketing expenses related to
the UEFA EURO 2008™ and the Beijing 2008 Olympic Games,
marketing working budget as a percentage of net sales
decreased slightly compared to the prior year as a result of the
segment’s strong sales growth. In 2008, the adidas segment
had higher operating overhead costs as a percentage of sales,
mainly due to higher sales expenses in emerging markets
related to sales growth. In euro terms, net other operating
expenses and income grew 10% to € 2.784 billion in 2008 from
€ 2.530 billion in 2007.
Operating margin increases to 14.0%
In 2008, the adidas operating margin increased 1.1 percentage
points to 14.0% (2007: 12.9%). This development was in line
with Management’s initial expectation of an operating margin
improvement. The increase results from gross margin expan-
sion and stable net other operating expenses and income as
a percentage of sales. Operating profi t for the adidas segment
increased 19% to € 1.098 billion in 2008 versus € 920 million
during the same period in the prior year.