Reebok 2008 Annual Report Download - page 107
Download and view the complete annual report
Please find page 107 of the 2008 Reebok annual report below. You can navigate through the pages in the report by either clicking on the pages listed below, or by using the keyword search tool below to find specific information within the annual report.-
 1
1 -
2
-
3
-
4
-
5
-
6
-
7
-
8
-
9
-
10
-
11
-
12
-
13
-
14
-
15
-
16
-
17
-
18
-
19
-
20
-
21
-
22
-
23
-
24
-
25
-
26
-
27
-
28
-
29
-
30
-
31
-
32
-
33
-
34
-
35
-
36
-
37
-
38
-
39
-
40
-
41
-
42
-
43
-
44
-
45
-
46
-
47
-
48
-
49
-
50
-
51
-
52
-
53
-
54
-
55
-
56
-
57
-
58
-
59
-
60
-
61
-
62
-
63
-
64
-
65
-
66
-
67
-
68
-
69
-
70
-
71
-
72
-
73
-
74
-
75
-
76
-
77
-
78
-
79
-
80
-
81
-
82
-
83
-
84
-
85
-
86
-
87
-
88
-
89
-
90
-
91
-
92
-
93
-
94
-
95
-
96
-
 97
97 -
 98
98 -
 99
99 -
 100
100 -
 101
101 -
 102
102 -
 103
103 -
 104
104 -
 105
105 -
 106
106 -
 107
107 -
 108
108 -
 109
109 -
 110
110 -
 111
111 -
 112
112 -
 113
113 -
 114
114 -
 115
115 -
 116
116 -
 117
117 -
118
-
119
-
120
-
121
-
122
-
123
-
124
-
125
-
126
-
127
-
128
-
129
-
130
-
131
-
132
-
133
-
134
-
135
-
136
-
137
-
138
-
139
-
140
-
141
-
142
-
143
-
144
-
145
-
146
-
147
-
148
-
149
-
150
-
151
-
152
-
153
-
154
-
155
-
156
-
157
-
158
-
159
-
160
-
161
-
162
-
163
-
164
-
165
-
166
-
167
-
168
-
169
-
170
-
171
-
172
-
173
-
174
-
175
-
176
-
177
-
178
-
179
-
180
-
181
-
182
-
183
-
184
-
185
-
186
-
187
-
188
-
189
-
190
-
191
-
192
-
193
-
194
-
195
-
196
-
197
-
198
-
199
-
200
-
201
-
202
-
203
-
204
-
205
-
206
-
207
-
208
-
209
-
210
-
211
-
212
-
213
-
214
-
215
-
216
-
217
-
218
-
219
-
220
 |
 |
adidas Group Annual Report 2008 103
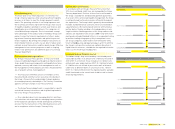
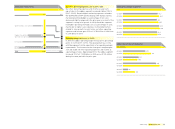
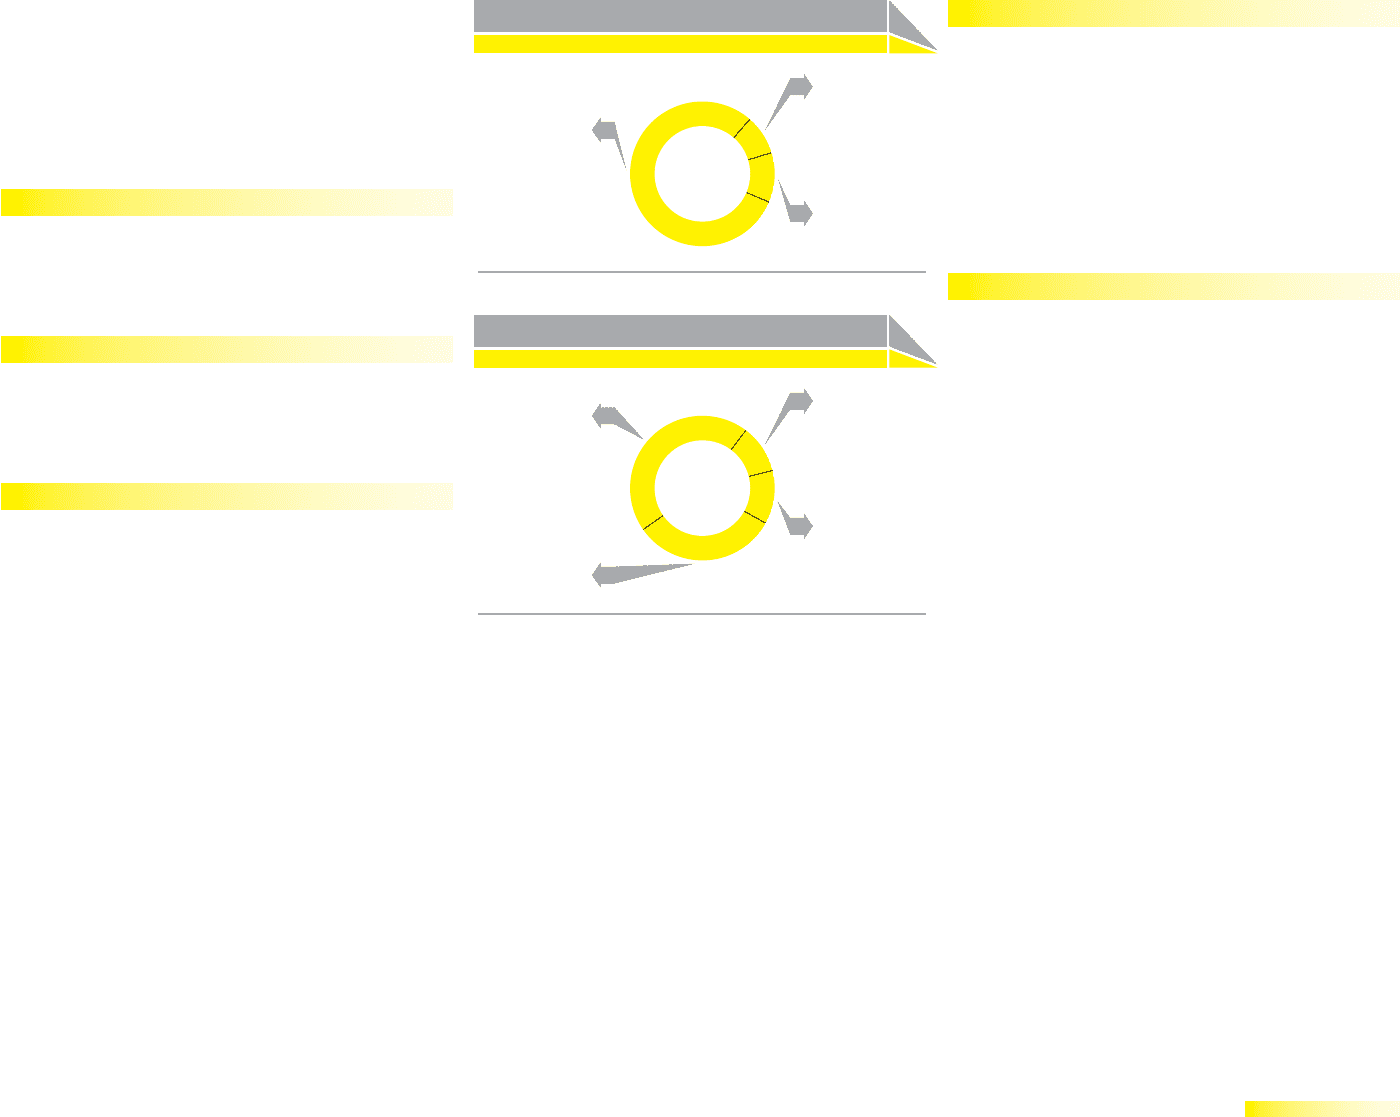
2008 Reebok net sales by region
North America 45%
Europe 32%
Latin America 11%
Asia 12%
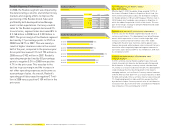
2008 Reebok net sales by division
Reebok 80%
Reebok-
CCM Hockey 9%
Rockport 11%
Currency translation effects negatively impacted sales in
euro terms in all regions. In euro terms, segment sales in
Europe decreased 8% to € 691 million in 2008 from € 748 mil-
lion in 2007. In North America, revenues declined 22% to
€ 964 million in 2008 from € 1.231 billion in 2007. Sales in Asia
decreased 1% to € 267 million in 2008 (2007: € 269 million),
and in Latin America revenues increased 170% to € 226 million
in 2008 (2007: € 84 million).
Currency-neutral sales of brand Reebok stable
Brand Reebok sales were almost unchanged compared to the
prior year on a currency-neutral basis. An increase in the run-
ning category was offset by declines in lifestyle and in most
major sports categories. In euro terms, sales decreased 6% to
€ 1.717 billion (2007: € 1.831 billion).
Currency-neutral sales of Reebok-CCM Hockey down 6%
Sales of Reebok-CCM Hockey decreased 6% on a currency-
neutral basis in 2008. This was due to the decline in the
licensed jersey business compared to the prior year. In euro
terms, sales decreased 11% to € 188 million in 2008 versus
€ 210 million in the prior year.
Rockport sales decline 10% on a currency-neutral basis
Rockport sales decreased 10% on a currency-neutral basis
in 2008. This mainly refl ects the challenging market environ-
ment in the USA, in particular in the department store and
mall-based retail channels. In euro terms, Rockport revenues
decreased 17% to € 243 million in 2008 (2007: € 291 million).
Currency-neutral own-retail sales grow 17%
In 2008, Reebok own-retail sales grew 17% on a currency-
neutral basis. In euro terms, revenues increased 8% to
€ 379 million from € 350 million in 2007. The increase was
largely driven by new store openings in emerging markets,
especially Russia. Reebok own-retail activities made up 18% of
Reebok segment sales in 2008, up from 15% in the prior year.
The share of own-retail activities as a percentage of brand
sales at Rockport was signifi cantly above the segment average.
During the year, the number of Reebok and Rockport stores
increased by 123 to 647 (2007: 524). The store base at the end
of 2008 comprised 253 concept stores and 327 factory outlets.
Reebok segment gross margin declines 1.7 percentage points
The gross margin of the Reebok segment decreased 1.7 per-
centage points to 37.0% in 2008 from 38.7% in 2007. This
development was below Management’s initial expectation of a
gross margin increase. The segment gross margin was nega-
tively affected by clearance initiatives in particular in the USA
and the UK in the second half of the year. Reebok gross profi t
decreased 12% to € 795 million in 2008 versus € 902 million in
2007.