Reebok 2008 Annual Report Download - page 157
Download and view the complete annual report
Please find page 157 of the 2008 Reebok annual report below. You can navigate through the pages in the report by either clicking on the pages listed below, or by using the keyword search tool below to find specific information within the annual report.-
 1
1 -
2
-
3
-
4
-
5
-
6
-
7
-
8
-
9
-
10
-
11
-
12
-
13
-
14
-
15
-
16
-
17
-
18
-
19
-
20
-
21
-
22
-
23
-
24
-
25
-
26
-
27
-
28
-
29
-
30
-
31
-
32
-
33
-
34
-
35
-
36
-
37
-
38
-
39
-
40
-
41
-
42
-
43
-
44
-
45
-
46
-
47
-
48
-
49
-
50
-
51
-
52
-
53
-
54
-
55
-
56
-
57
-
58
-
59
-
60
-
61
-
62
-
63
-
64
-
65
-
66
-
67
-
68
-
69
-
70
-
71
-
72
-
73
-
74
-
75
-
76
-
77
-
78
-
79
-
80
-
81
-
82
-
83
-
84
-
85
-
86
-
87
-
88
-
89
-
90
-
91
-
92
-
93
-
94
-
95
-
96
-
97
-
98
-
99
-
100
-
101
-
102
-
103
-
104
-
105
-
106
-
107
-
108
-
109
-
110
-
111
-
112
-
113
-
114
-
115
-
116
-
117
-
118
-
119
-
120
-
121
-
122
-
123
-
124
-
125
-
126
-
127
-
128
-
129
-
130
-
131
-
132
-
133
-
134
-
135
-
136
-
137
-
138
-
139
-
140
-
141
-
142
-
143
-
144
-
145
-
146
-
 147
147 -
 148
148 -
 149
149 -
 150
150 -
 151
151 -
 152
152 -
 153
153 -
 154
154 -
 155
155 -
 156
156 -
 157
157 -
 158
158 -
 159
159 -
 160
160 -
 161
161 -
 162
162 -
 163
163 -
 164
164 -
 165
165 -
 166
166 -
 167
167 -
168
-
169
-
170
-
171
-
172
-
173
-
174
-
175
-
176
-
177
-
178
-
179
-
180
-
181
-
182
-
183
-
184
-
185
-
186
-
187
-
188
-
189
-
190
-
191
-
192
-
193
-
194
-
195
-
196
-
197
-
198
-
199
-
200
-
201
-
202
-
203
-
204
-
205
-
206
-
207
-
208
-
209
-
210
-
211
-
212
-
213
-
214
-
215
-
216
-
217
-
218
-
219
-
220
 |
 |
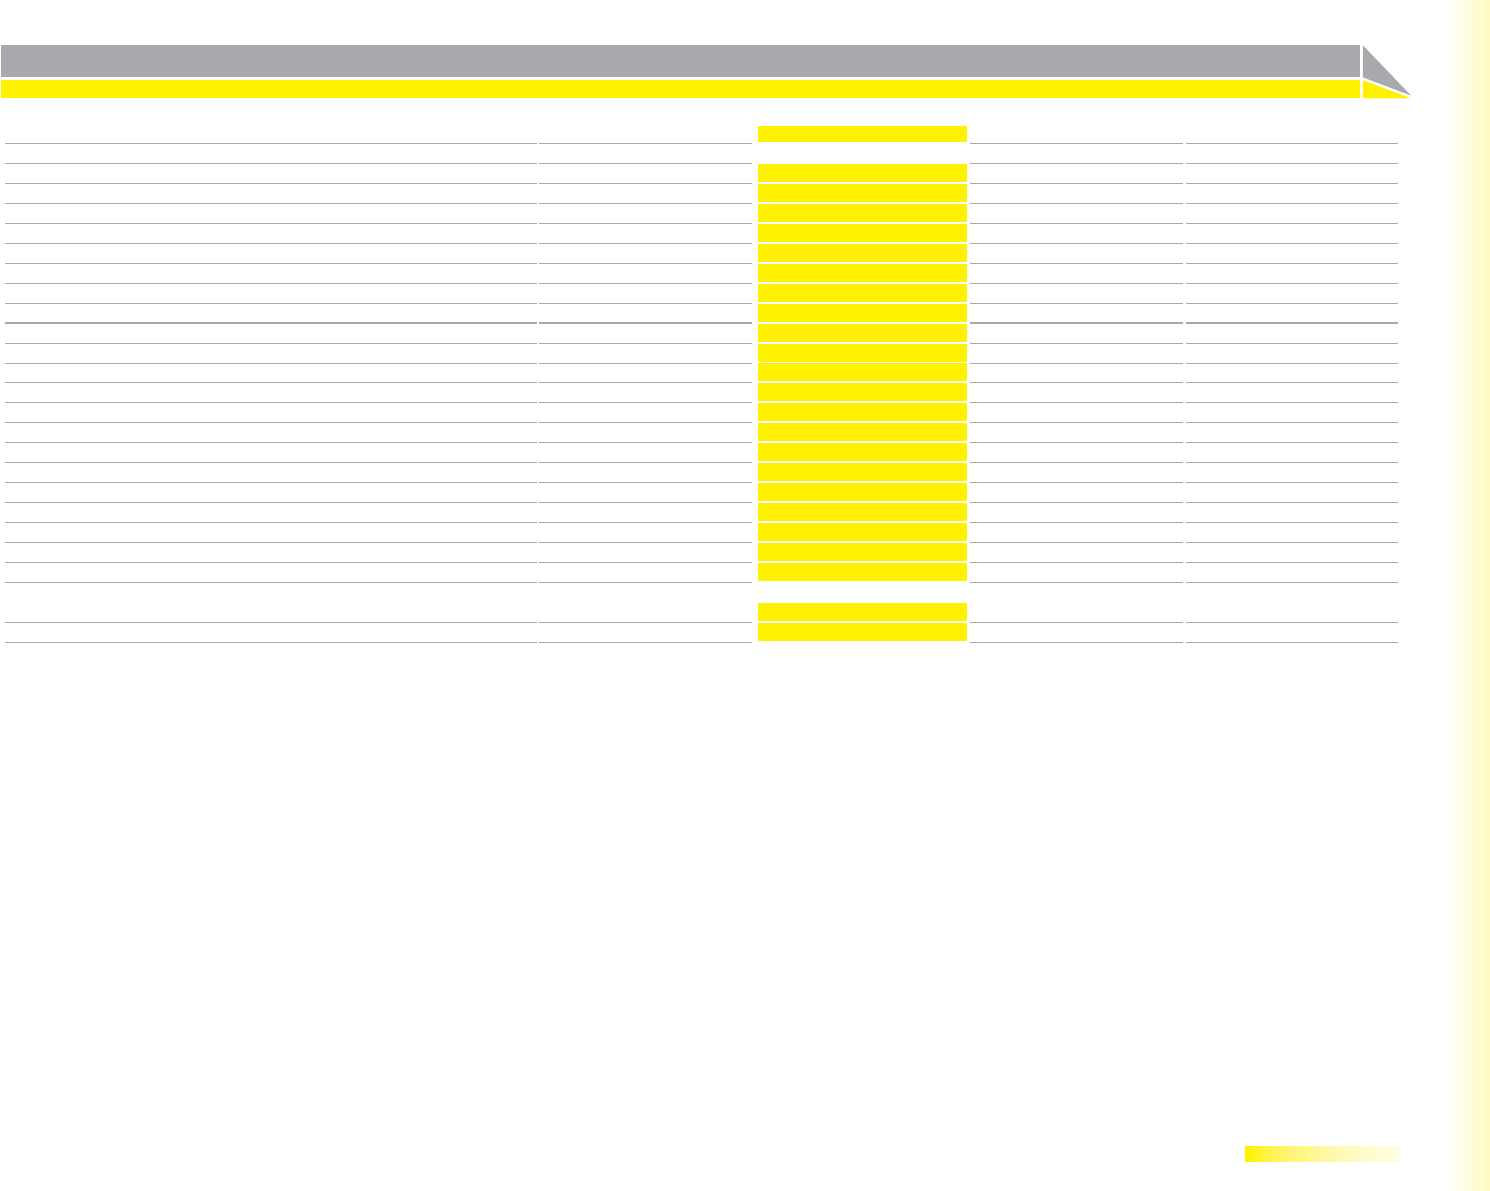
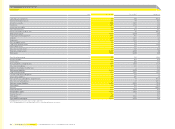
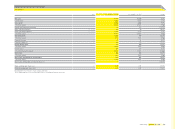
adidas Group Annual Report 2008 153
Consolidated income statement (IFRS)
€ in millions
Note Year ending Dec. 31, 2008 Year ending Dec. 31, 2007 Change
Net sales 30 10,799 10,299 4.9%
Cost of sales 5,543 5,417 2.3%
Gross profi t 5,256 4,882 7.7%
(% of net sales) 48.7% 47.4% 1.3pp
Royalty and commission income 89 102 (12.7%)
Other operating income 10, 12, 24 103 80 28.4%
Other operating expenses 10, 12, 25 4,378 4,115 6.4%
(% of net sales) 40.5% 40.0% 0.6pp
Operating profi t 1,070 949 12.7%
(% of net sales) 9.9% 9.2% 0.7pp
Financial income 27 37 36 5.4%
Financial expenses 27 203 170 19.2%
Income before taxes 904 815 11.0%
(% of net sales) 8.4% 7.9% 0.5pp
Income taxes 28 260 260 0.4%
(% of income before taxes) 28.8% 31.8% (3.0pp)
Net income 644 555 16.0%
(% of net sales) 6.0% 5.4% 0.6pp
Net income attributable to shareholders 642 551 16.4%
(% of net sales) 5.9% 5.4% 0.6pp
Net income attributable to minority interests 2 4 (38.9%)
Basic earnings per share (in €) 29 3.25 2.71 19.9%
Diluted earnings per share (in €) 29 3.07 2.57 19.6%
Rounding differences may arise in percentages and totals.
The accompanying Notes are an integral part of these consolidated fi nancial statements.