Reebok 2008 Annual Report Download - page 104
Download and view the complete annual report
Please find page 104 of the 2008 Reebok annual report below. You can navigate through the pages in the report by either clicking on the pages listed below, or by using the keyword search tool below to find specific information within the annual report.-
 1
1 -
2
-
3
-
4
-
5
-
6
-
7
-
8
-
9
-
10
-
11
-
12
-
13
-
14
-
15
-
16
-
17
-
18
-
19
-
20
-
21
-
22
-
23
-
24
-
25
-
26
-
27
-
28
-
29
-
30
-
31
-
32
-
33
-
34
-
35
-
36
-
37
-
38
-
39
-
40
-
41
-
42
-
43
-
44
-
45
-
46
-
47
-
48
-
49
-
50
-
51
-
52
-
53
-
54
-
55
-
56
-
57
-
58
-
59
-
60
-
61
-
62
-
63
-
64
-
65
-
66
-
67
-
68
-
69
-
70
-
71
-
72
-
73
-
74
-
75
-
76
-
77
-
78
-
79
-
80
-
81
-
82
-
83
-
84
-
85
-
86
-
87
-
88
-
89
-
90
-
91
-
92
-
93
-
 94
94 -
 95
95 -
 96
96 -
 97
97 -
 98
98 -
 99
99 -
 100
100 -
 101
101 -
 102
102 -
 103
103 -
 104
104 -
 105
105 -
 106
106 -
 107
107 -
 108
108 -
 109
109 -
 110
110 -
 111
111 -
 112
112 -
 113
113 -
 114
114 -
115
-
116
-
117
-
118
-
119
-
120
-
121
-
122
-
123
-
124
-
125
-
126
-
127
-
128
-
129
-
130
-
131
-
132
-
133
-
134
-
135
-
136
-
137
-
138
-
139
-
140
-
141
-
142
-
143
-
144
-
145
-
146
-
147
-
148
-
149
-
150
-
151
-
152
-
153
-
154
-
155
-
156
-
157
-
158
-
159
-
160
-
161
-
162
-
163
-
164
-
165
-
166
-
167
-
168
-
169
-
170
-
171
-
172
-
173
-
174
-
175
-
176
-
177
-
178
-
179
-
180
-
181
-
182
-
183
-
184
-
185
-
186
-
187
-
188
-
189
-
190
-
191
-
192
-
193
-
194
-
195
-
196
-
197
-
198
-
199
-
200
-
201
-
202
-
203
-
204
-
205
-
206
-
207
-
208
-
209
-
210
-
211
-
212
-
213
-
214
-
215
-
216
-
217
-
218
-
219
-
220
 |
 |
100 Group Management Report – Our Financial Year Business Performance by Segment — adidas Business Performance
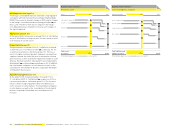
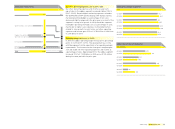
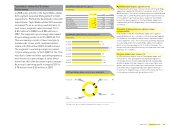
2008 adidas net sales by region
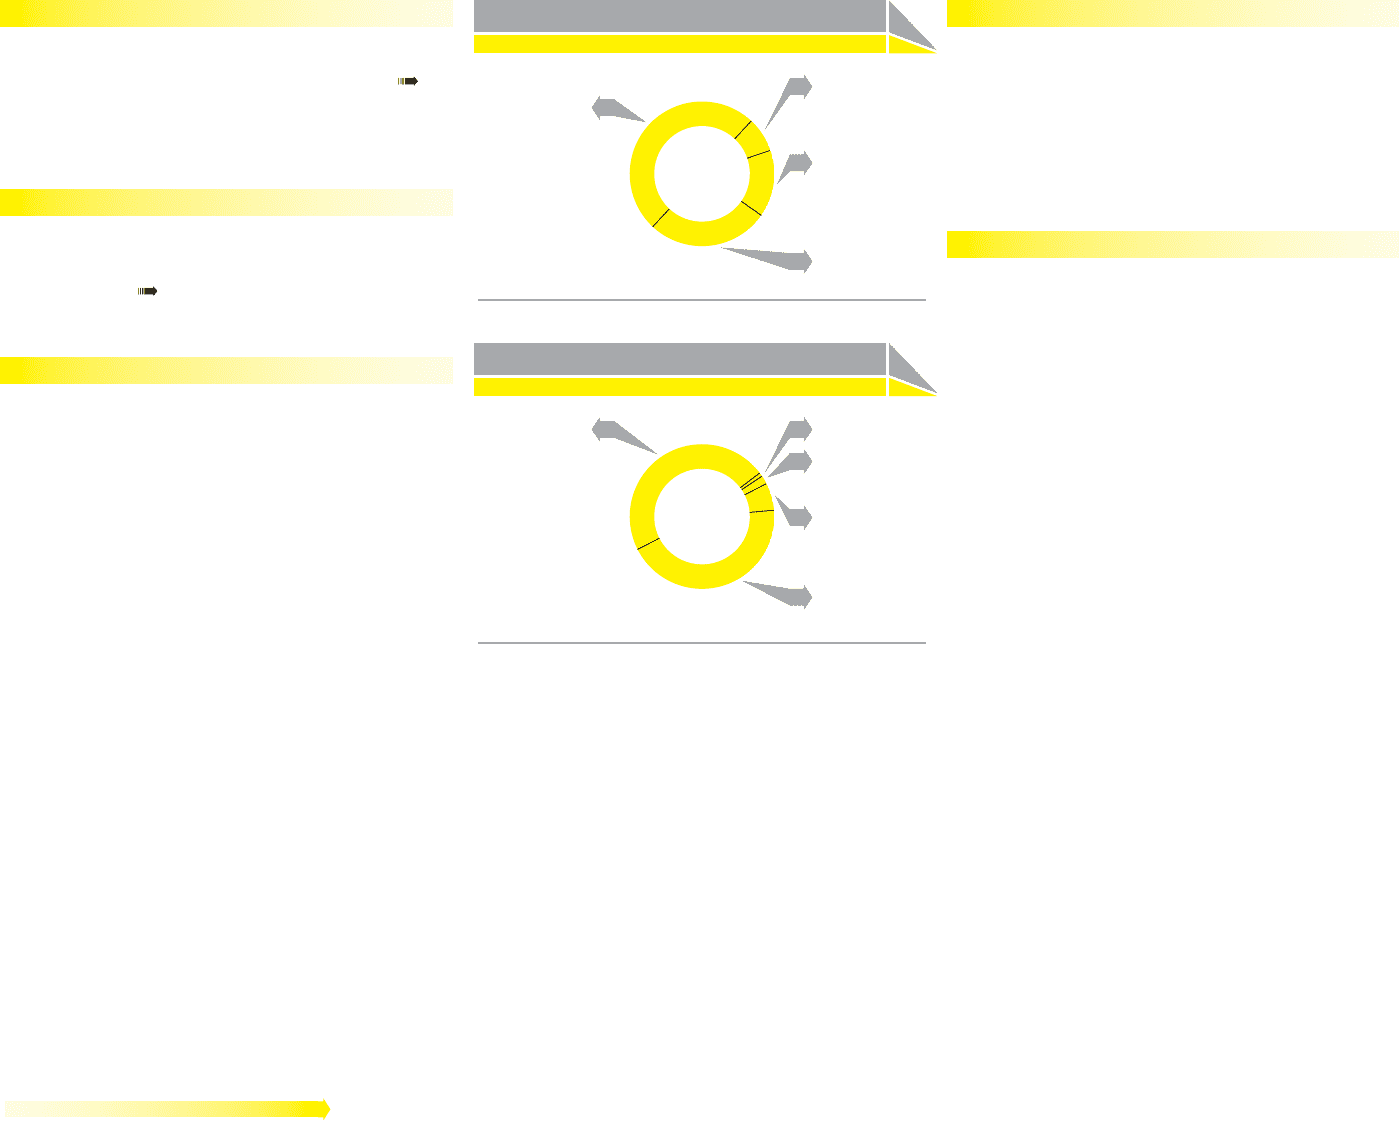
2008 adidas own-retail sales by channel
Europe 50%
Factory Outlets 47%
Latin America 8%
North America 15%
Asia 27%
Internet 1%
Concession
Corners 2%
Originals
Concept Stores 6%
Sport Performance
Concept Stores 44%
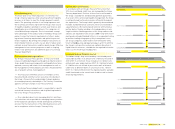
Sport Performance up 15% on a currency-neutral basis
Sales in the Sport Performance division increased 15% on a
currency-neutral basis in 2008. The key categories identifi ed
by brand management as medium-term growth drivers see
adidas Strategy, p. 048 all grew at a double-digit rate with particu-
larly strong increases in the running and football categories. In
euro terms, Sport Performance sales improved 11% in 2008 to
€ 6.250 billion from € 5.608 billion in the prior year.
Sport Style increases 10% on a currency-neutral basis
Sales in the Sport Style division increased 10% on a currency-
neutral basis in 2008. Sales increased in both Originals and
Fashion (which includes Y-3 and Porsche Design). The launch
of Style Essentials see adidas Strategy, p. 048 also contributed
to this development. In euro terms, Sport Style sales grew 6%
to € 1.535 billion in 2008 (2007: € 1.455 billion).
Currency-neutral own-retail sales up 24%
In 2008, adidas own-retail sales increased 24% on a currency-
neutral basis. In euro terms, revenues grew 17% to € 1.432 bil-
lion from € 1.229 billion in 2007. This increase was driven by
new store openings and mid-single-digit increases in com-
parable store sales. adidas own-retail activities made up 18%
of adidas brand sales in 2008, up from 17% in the prior year.
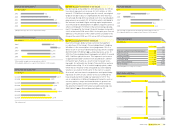
At December 31, 2008, the total number of adidas stores was
1,332, representing an increase of 329 (2007: 1,003 stores). The
majority of new stores were opened in emerging markets with
under-developed retail infrastructure. The major opening in
2008 was the world’s biggest adidas store in Beijing. The store
base at the end of 2008 comprised 796 concept stores, 381 fac-
tory outlets, 150 concession corners and 5 e-commerce stores.
Full year gross margin improves to record level of 48.6%
The adidas segment gross margin increased 1.2 percentage
points to 48.6% in 2008 from 47.4% in 2007. This is the highest
annual gross margin in the adidas segment since the IPO in
1995. This development was in line with Management’s initial
expectation of a gross margin improvement. The increase
was primarily driven by an improving regional mix, further
own-retail expansion and a more favourable product mix. As a
result, adidas gross profi t grew 13% to € 3.802 billion in 2008
versus € 3.370 billion in 2007.
Royalty and commission income stable
In 2008, adidas royalty and commission income remained
stable at € 80 million (2007: € 80 million). Royalty and com-
mission income relates to items such as cosmetics, watches
and eyewear.