Chrysler 2009 Annual Report Download - page 89
Download and view the complete annual report
Please find page 89 of the 2009 Chrysler annual report below. You can navigate through the pages in the report by either clicking on the pages listed below, or by using the keyword search tool below to find specific information within the annual report.-
 1
1 -
2
-
3
-
4
-
5
-
6
-
7
-
8
-
9
-
10
-
11
-
12
-
13
-
14
-
15
-
16
-
17
-
18
-
19
-
20
-
21
-
22
-
23
-
24
-
25
-
26
-
27
-
28
-
29
-
30
-
31
-
32
-
33
-
34
-
35
-
36
-
37
-
38
-
39
-
40
-
41
-
42
-
43
-
44
-
45
-
46
-
47
-
48
-
49
-
50
-
51
-
52
-
53
-
54
-
55
-
56
-
57
-
58
-
59
-
60
-
61
-
62
-
63
-
64
-
65
-
66
-
67
-
68
-
69
-
70
-
71
-
72
-
73
-
74
-
75
-
76
-
77
-
78
-
 79
79 -
 80
80 -
 81
81 -
 82
82 -
 83
83 -
 84
84 -
 85
85 -
 86
86 -
 87
87 -
 88
88 -
 89
89 -
 90
90 -
 91
91 -
 92
92 -
 93
93 -
 94
94 -
 95
95 -
 96
96 -
 97
97 -
 98
98 -
 99
99 -
100
-
101
-
102
-
103
-
104
-
105
-
106
-
107
-
108
-
109
-
110
-
111
-
112
-
113
-
114
-
115
-
116
-
117
-
118
-
119
-
120
-
121
-
122
-
123
-
124
-
125
-
126
-
127
-
128
-
129
-
130
-
131
-
132
-
133
-
134
-
135
-
136
-
137
-
138
-
139
-
140
-
141
-
142
-
143
-
144
-
145
-
146
-
147
-
148
-
149
-
150
-
151
-
152
-
153
-
154
-
155
-
156
-
157
-
158
-
159
-
160
-
161
-
162
-
163
-
164
-
165
-
166
-
167
-
168
-
169
-
170
-
171
-
172
-
173
-
174
-
175
-
176
-
177
-
178
-
179
-
180
-
181
-
182
-
183
-
184
-
185
-
186
-
187
-
188
-
189
-
190
-
191
-
192
-
193
-
194
-
195
-
196
-
197
-
198
-
199
-
200
-
201
-
202
-
203
-
204
-
205
-
206
-
207
-
208
-
209
-
210
-
211
-
212
-
213
-
214
-
215
-
216
-
217
-
218
-
219
-
220
-
221
-
222
-
223
-
224
-
225
-
226
-
227
-
228
-
229
-
230
-
231
-
232
-
233
-
234
-
235
-
236
-
237
-
238
-
239
-
240
-
241
-
242
-
243
-
244
-
245
-
246
-
247
-
248
-
249
-
250
-
251
-
252
-
253
-
254
-
255
-
256
-
257
-
258
-
259
-
260
-
261
-
262
-
263
-
264
-
265
-
266
-
267
-
268
-
269
-
270
-
271
-
272
-
273
-
274
-
275
-
276
-
277
-
278
-
279
-
280
-
281
-
282
-
283
-
284
-
285
-
286
-
287
-
288
-
289
-
290
-
291
-
292
-
293
-
294
-
295
-
296
-
297
-
298
-
299
-
300
-
301
-
302
-
303
-
304
-
305
-
306
-
307
-
308
-
309
-
310
-
311
-
312
-
313
-
314
-
315
-
316
-
317
-
318
-
319
-
320
-
321
-
322
-
323
-
324
-
325
-
326
-
327
-
328
-
329
-
330
-
331
-
332
-
333
-
334
-
335
-
336
-
337
-
338
-
339
-
340
-
341
-
342
-
343
-
344
-
345
-
346
-
347
-
348
-
349
-
350
-
351
-
352
-
353
-
354
-
355
-
356
-
357
-
358
-
359
-
360
-
361
-
362
-
363
-
364
-
365
-
366
-
367
-
368
-
369
-
370
-
371
-
372
-
373
-
374
 |
 |
REPORT ON
OPERATIONS
OPERATING
PERFORMANCE
BY SECTOR
88
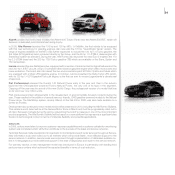
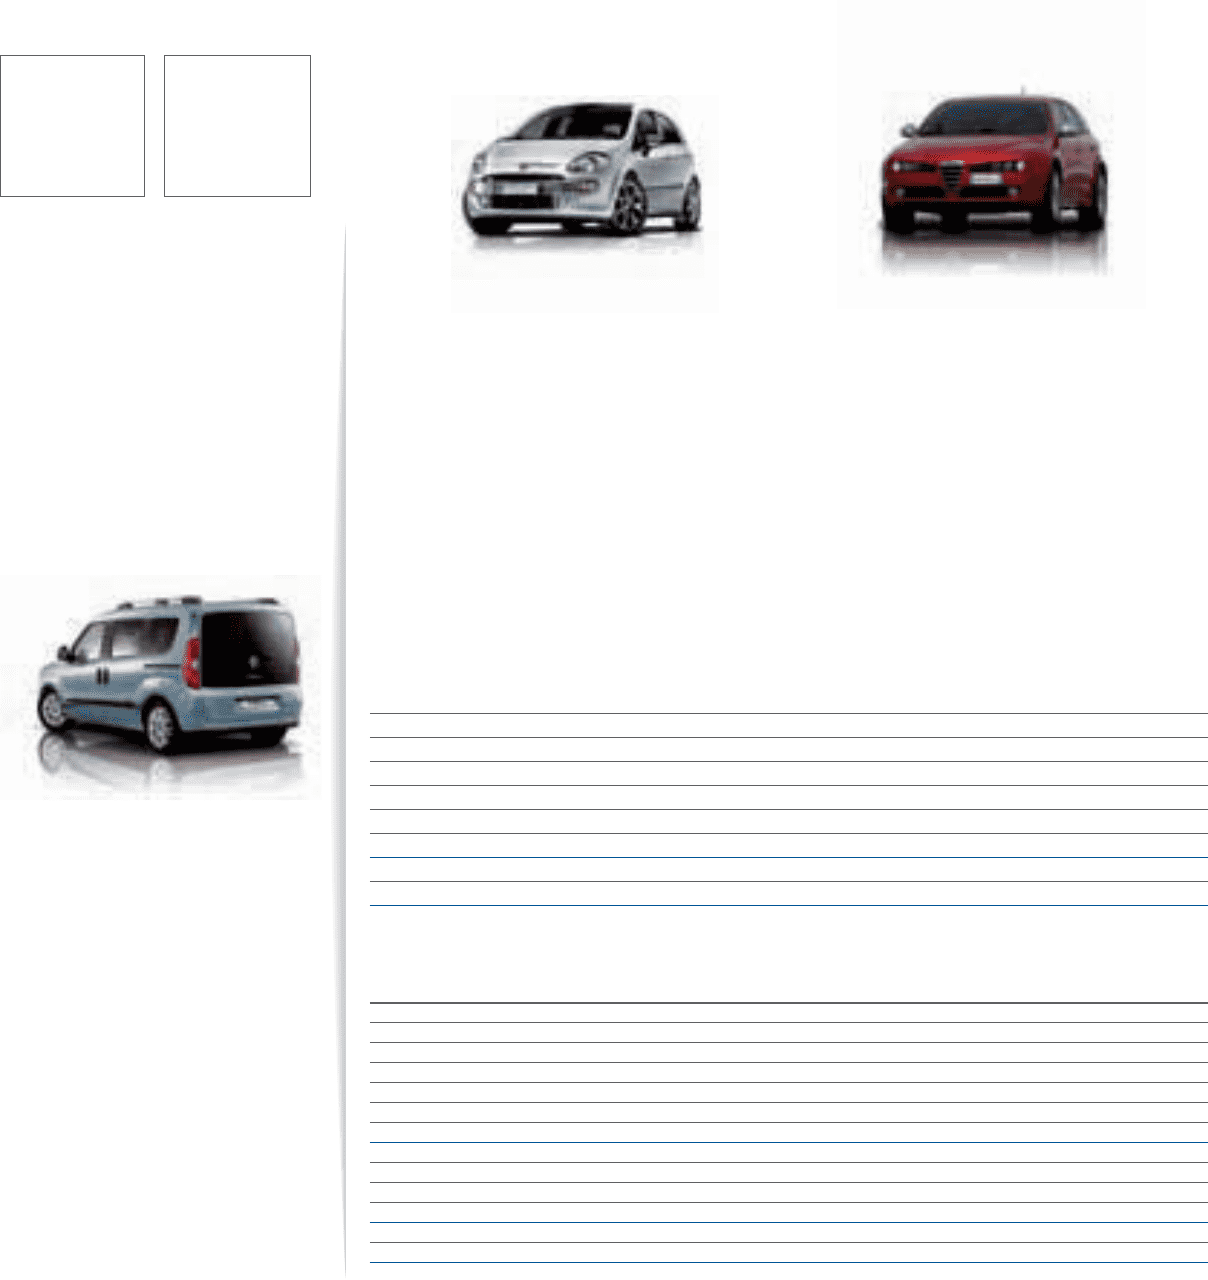
Fiat Professional’s market share for light commercial vehicles in Italy was 39.9%, down 3.4 percentage points
over 2008, driven by the phase out of the Doblò (with market supply of the new Doblò beginning in early 2010)
and the sharp drop in demand in the camper segment, where Fiat Professional has the lion’s share of the
market. In Western Europe, share was up slightly to 12.6% (+0.3 percentage points).
In Brazil, FGA maintained its leadership of the market, recording an overall share of 24.5% (-0.1 percentage
points over 2008). Share for passenger cars only was 24.6% (-0.3 percentage points). This was, however,
offset by an increase in market share for light commercial vehicles, which was up 1.1 percentage
points to 24.1%.
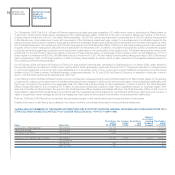
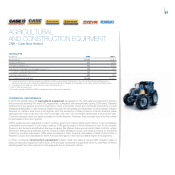
Fiat Group Automobiles delivered a total of 2,150,700 passenger cars and light commercial vehicles for the
year, in line with 2008 (-0.1%).
In Western Europe, total deliveries were unchanged at 1,238,100 units. Performance was positive in Italy
(+0.5%) and the UK (+5.2%) and very strong growth was achieved in Germany (+46.2%). There was a decrease
in France (-7.3%) and a sharp decline in Spain (-48.3%), which was also impacted by measures to realign dealer
inventory levels to market demand.
In Poland, volumes increased 1.8% over the 2008 level.
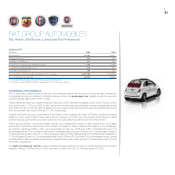
Passenger Car Market
(units in thousands) 2009 2008 % change
France 2,268.7 2,050.3 10.7
Germany 3,807.2 3,090.0 23.2
UK 1,995.0 2,131.8 -6.4
Italy 2,158.0 2,161.7 -0.2
Spain 952.8 1,161.2 -17.9
Western Europe 13,632.9 13,561.2 0.5
Poland 320.1 319.9 0.1
Brazil 2,520.2 2,237.3 12.6
Sales Performance
Passenger Cars and Light Commercial Vehicles
(units in thousands) 2009 2008 % change
France 114.8 123.8 -7.3
Germany 179.5 122.8 46.2
UK 75.1 71.4 5.2
Italy 721.9 718.1 0.5
Spain 25.2 48.7 -48.3
Rest of Western Europe 121.6 153.1 -20.6
Western Europe 1,238.1 1,237.9 -
Poland 42.4 41.6 1.8
Brazil 749.5 665.6 12.6
Rest of World 120.7 207.4 -41.8
Total Sales 2,150.7 2,152.5 -0.1
Associate companies 126.9 76.5 66.0
Grand Total 2,277.6 2,229.0 2.2