Chrysler 2009 Annual Report Download - page 103
Download and view the complete annual report
Please find page 103 of the 2009 Chrysler annual report below. You can navigate through the pages in the report by either clicking on the pages listed below, or by using the keyword search tool below to find specific information within the annual report.-
 1
1 -
2
-
3
-
4
-
5
-
6
-
7
-
8
-
9
-
10
-
11
-
12
-
13
-
14
-
15
-
16
-
17
-
18
-
19
-
20
-
21
-
22
-
23
-
24
-
25
-
26
-
27
-
28
-
29
-
30
-
31
-
32
-
33
-
34
-
35
-
36
-
37
-
38
-
39
-
40
-
41
-
42
-
43
-
44
-
45
-
46
-
47
-
48
-
49
-
50
-
51
-
52
-
53
-
54
-
55
-
56
-
57
-
58
-
59
-
60
-
61
-
62
-
63
-
64
-
65
-
66
-
67
-
68
-
69
-
70
-
71
-
72
-
73
-
74
-
75
-
76
-
77
-
78
-
79
-
80
-
81
-
82
-
83
-
84
-
85
-
86
-
87
-
88
-
89
-
90
-
91
-
92
-
 93
93 -
 94
94 -
 95
95 -
 96
96 -
 97
97 -
 98
98 -
 99
99 -
 100
100 -
 101
101 -
 102
102 -
 103
103 -
 104
104 -
 105
105 -
 106
106 -
 107
107 -
 108
108 -
 109
109 -
 110
110 -
 111
111 -
 112
112 -
 113
113 -
114
-
115
-
116
-
117
-
118
-
119
-
120
-
121
-
122
-
123
-
124
-
125
-
126
-
127
-
128
-
129
-
130
-
131
-
132
-
133
-
134
-
135
-
136
-
137
-
138
-
139
-
140
-
141
-
142
-
143
-
144
-
145
-
146
-
147
-
148
-
149
-
150
-
151
-
152
-
153
-
154
-
155
-
156
-
157
-
158
-
159
-
160
-
161
-
162
-
163
-
164
-
165
-
166
-
167
-
168
-
169
-
170
-
171
-
172
-
173
-
174
-
175
-
176
-
177
-
178
-
179
-
180
-
181
-
182
-
183
-
184
-
185
-
186
-
187
-
188
-
189
-
190
-
191
-
192
-
193
-
194
-
195
-
196
-
197
-
198
-
199
-
200
-
201
-
202
-
203
-
204
-
205
-
206
-
207
-
208
-
209
-
210
-
211
-
212
-
213
-
214
-
215
-
216
-
217
-
218
-
219
-
220
-
221
-
222
-
223
-
224
-
225
-
226
-
227
-
228
-
229
-
230
-
231
-
232
-
233
-
234
-
235
-
236
-
237
-
238
-
239
-
240
-
241
-
242
-
243
-
244
-
245
-
246
-
247
-
248
-
249
-
250
-
251
-
252
-
253
-
254
-
255
-
256
-
257
-
258
-
259
-
260
-
261
-
262
-
263
-
264
-
265
-
266
-
267
-
268
-
269
-
270
-
271
-
272
-
273
-
274
-
275
-
276
-
277
-
278
-
279
-
280
-
281
-
282
-
283
-
284
-
285
-
286
-
287
-
288
-
289
-
290
-
291
-
292
-
293
-
294
-
295
-
296
-
297
-
298
-
299
-
300
-
301
-
302
-
303
-
304
-
305
-
306
-
307
-
308
-
309
-
310
-
311
-
312
-
313
-
314
-
315
-
316
-
317
-
318
-
319
-
320
-
321
-
322
-
323
-
324
-
325
-
326
-
327
-
328
-
329
-
330
-
331
-
332
-
333
-
334
-
335
-
336
-
337
-
338
-
339
-
340
-
341
-
342
-
343
-
344
-
345
-
346
-
347
-
348
-
349
-
350
-
351
-
352
-
353
-
354
-
355
-
356
-
357
-
358
-
359
-
360
-
361
-
362
-
363
-
364
-
365
-
366
-
367
-
368
-
369
-
370
-
371
-
372
-
373
-
374
 |
 |

REPORT ON
OPERATIONS
OPERATING
PERFORMANCE
BY SECTOR
102
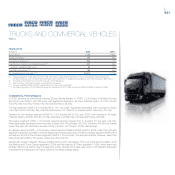
Iveco’s market share in Western Europe (GVW >_ 2.8 tonnes) was 9.2% (down 0.7 percentage points vs. 2008).
Share in the light segment (7.9%) was down 0.5 percentage points overall, heavily influenced by the performance
in France, but up in Italy and Spain (+0.4 percentage points and +0.8 percentage points, respectively). Share
for the medium segment decreased 0.7 percentage points to 24.2%, despite the share gains achieved in Italy
and France. In the heavy segment, Iveco’s share was 9.3%, representing a decline of 1.1 percentage points,
attributable entirely to an unfavourable market mix, which more than offset the positive performance in Italy
(+0.6 percentage points), France (+0.4 percentage points) and Spain (+2.7 percentage points).
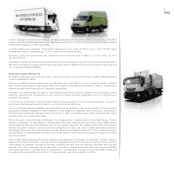
In Eastern Europe, Iveco’s market share for 2009 (GVW >_ 2.8 tonnes) was 10.7% (down 1.1 percentage points
vs. 2008), with falls in both the light vehicle segment (-0.9 percentage points) and the medium vehicle segment
(-3.3 percentage points). Share of the heavy vehicle segment was in line with 2008.
Iveco Irisbus’ market share of 18.3% in Western Europe was substantially in line with 2008. The reductions
experienced in France and Italy, where Iveco nevertheless maintained its position as market leader, were offset
by significant growth in Germany and the Scandinavian countries.
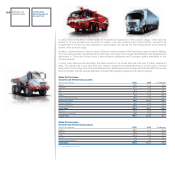
In 2009, Iveco delivered a total of 103,866 vehicles, representing a 45.9% decrease over the prior year. In
Western Europe, 66,754 vehicles were delivered (down 46.7%), with decreases experienced in all principal
markets, in particular: the UK (-73.1%), Spain (-60.3%), France (-45.9%), Germany (-43.3%) and Italy (-30.7%).
The sharpest decline was in the heavy segment, which plummeted 61.9% over the previous year, while light
and medium vehicles fell by 41.9% and 40.8%, respectively. In Eastern Europe, deliveries contracted 72.6%.
The decline was less marked in the Latin American markets where Iveco offers its full range of vehicles: 17,001
units were sold in 2009, down 19.1% over the 21,012 figure for 2008.
Iveco delivered a total of 7,771 buses during the year, an 18.7% decline from 2008.
Commercial Vehicle Market (GVW >
− 2.8 tonnes)
(units in thousands) 2009 2008 % change
France 155.1 221.5 -30.0
Germany 197.6 276.5 -28.5
UK 116.1 195.4 -40.6
Italy 83.1 125.1 -33.6
Spain 41.7 86.5 -51.7
Rest of Western Europe 171.6 264.8 -35.2
Western Europe 765.2 1,169.8 -34.6
Commercial Vehicle Market by product (GVW >
− 2.8 tonnes)
(units in thousands) 2009 2008 % change
Heavy 149.5 267.4 -44.1
Medium 49.2 73.5 -33.1
Light 566.5 828.9 -31.7
Western Europe 765.2 1,169.8 -34.6