Chrysler 2009 Annual Report Download - page 130
Download and view the complete annual report
Please find page 130 of the 2009 Chrysler annual report below. You can navigate through the pages in the report by either clicking on the pages listed below, or by using the keyword search tool below to find specific information within the annual report.-
 1
1 -
2
-
3
-
4
-
5
-
6
-
7
-
8
-
9
-
10
-
11
-
12
-
13
-
14
-
15
-
16
-
17
-
18
-
19
-
20
-
21
-
22
-
23
-
24
-
25
-
26
-
27
-
28
-
29
-
30
-
31
-
32
-
33
-
34
-
35
-
36
-
37
-
38
-
39
-
40
-
41
-
42
-
43
-
44
-
45
-
46
-
47
-
48
-
49
-
50
-
51
-
52
-
53
-
54
-
55
-
56
-
57
-
58
-
59
-
60
-
61
-
62
-
63
-
64
-
65
-
66
-
67
-
68
-
69
-
70
-
71
-
72
-
73
-
74
-
75
-
76
-
77
-
78
-
79
-
80
-
81
-
82
-
83
-
84
-
85
-
86
-
87
-
88
-
89
-
90
-
91
-
92
-
93
-
94
-
95
-
96
-
97
-
98
-
99
-
100
-
101
-
102
-
103
-
104
-
105
-
106
-
107
-
108
-
109
-
110
-
111
-
112
-
113
-
114
-
115
-
116
-
117
-
118
-
119
-
 120
120 -
 121
121 -
 122
122 -
 123
123 -
 124
124 -
 125
125 -
 126
126 -
 127
127 -
 128
128 -
 129
129 -
 130
130 -
 131
131 -
 132
132 -
 133
133 -
 134
134 -
 135
135 -
 136
136 -
 137
137 -
 138
138 -
 139
139 -
 140
140 -
141
-
142
-
143
-
144
-
145
-
146
-
147
-
148
-
149
-
150
-
151
-
152
-
153
-
154
-
155
-
156
-
157
-
158
-
159
-
160
-
161
-
162
-
163
-
164
-
165
-
166
-
167
-
168
-
169
-
170
-
171
-
172
-
173
-
174
-
175
-
176
-
177
-
178
-
179
-
180
-
181
-
182
-
183
-
184
-
185
-
186
-
187
-
188
-
189
-
190
-
191
-
192
-
193
-
194
-
195
-
196
-
197
-
198
-
199
-
200
-
201
-
202
-
203
-
204
-
205
-
206
-
207
-
208
-
209
-
210
-
211
-
212
-
213
-
214
-
215
-
216
-
217
-
218
-
219
-
220
-
221
-
222
-
223
-
224
-
225
-
226
-
227
-
228
-
229
-
230
-
231
-
232
-
233
-
234
-
235
-
236
-
237
-
238
-
239
-
240
-
241
-
242
-
243
-
244
-
245
-
246
-
247
-
248
-
249
-
250
-
251
-
252
-
253
-
254
-
255
-
256
-
257
-
258
-
259
-
260
-
261
-
262
-
263
-
264
-
265
-
266
-
267
-
268
-
269
-
270
-
271
-
272
-
273
-
274
-
275
-
276
-
277
-
278
-
279
-
280
-
281
-
282
-
283
-
284
-
285
-
286
-
287
-
288
-
289
-
290
-
291
-
292
-
293
-
294
-
295
-
296
-
297
-
298
-
299
-
300
-
301
-
302
-
303
-
304
-
305
-
306
-
307
-
308
-
309
-
310
-
311
-
312
-
313
-
314
-
315
-
316
-
317
-
318
-
319
-
320
-
321
-
322
-
323
-
324
-
325
-
326
-
327
-
328
-
329
-
330
-
331
-
332
-
333
-
334
-
335
-
336
-
337
-
338
-
339
-
340
-
341
-
342
-
343
-
344
-
345
-
346
-
347
-
348
-
349
-
350
-
351
-
352
-
353
-
354
-
355
-
356
-
357
-
358
-
359
-
360
-
361
-
362
-
363
-
364
-
365
-
366
-
367
-
368
-
369
-
370
-
371
-
372
-
373
-
374
 |
 |
129
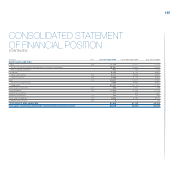
At 31 December 2009 At 31 December 2008
of which of which
Related parties Related parties
(€ million) Note Total (Note 35) Total (Note 35)
ASSETS
Intangible assets (14) 7,199 - 7,048 -
Property, plant and equipment (15) 12,945 - 12,515 -
Investment property - - - -
Investments and other financial assets: (16) 2,159 1,979 2,177 1,947
Investments accounted for using the equity method 1,884 1,884 1,899 1,899
Other investments and financial assets 275 95 278 48
Leased assets (17) 457 - 505 -
Defined benefit plan assets 144 - 120 -
Deferred tax assets (11) 2,580 - 2,386 -
Total Non-current assets 25,484 24,751
Inventories (18) 8,748 10 11,438 2
Trade receivables (19) 3,649 595 4,390 627
Receivables from financing activities (19) 12,695 120 13,136 134
Current tax receivables (19) 674 - 770 2
Other current assets (19) 2,778 65 2,600 51
Current financial assets 899 52 967 46
Current investments 46 - 26 -
Current securities (20) 217 - 177 -
Other financial assets (21) 636 52 764 46
Cash and cash equivalents (22) 12,226 651 3,683 101
Total Current assets 41,669 36,984
Assets held for sale (23) 82 59 37 -
TOTAL ASSETS 67,235 61,772
EQUITY AND LIABILITIES
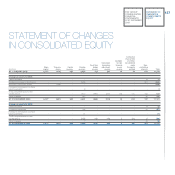
Equity: (24) 11,115 - 11,101 -
Issued capital and reserves attributable to owners of the parent 10,301 - 10,354 -
Non-controlling interest 814 - 747 -
Provisions: 8,432 80 8,144 70
Employee benefits (25) 3,447 30 3,366 22
Other provisions (26) 4,985 50 4,778 48
Debt: (27) 28,527 1,144 21,379 773
Asset-backed financing 7,086 486 6,663 279
Other debt 21,441 658 14,716 494
Other financial liabilities (21) 464 49 1,202 95
Trade payables (28) 12,295 886 13,258 1,051
Current tax payables 377 - 331 2
Deferred tax liabilities (11) 152 - 170 -
Other current liabilities (29) 5,865 181 6,185 153
Liabilities held for sale (23) 8 1 2 -
TOTAL EQUITY AND LIABILITIES 67,235 61,772
CONSOLIDATED STATEMENT
OF FINANCIAL POSITION
pursuant to Consob Resolution No. 15519 of 27 July 2006
FIAT GROUP
CONSOLIDATED
FINANCIAL
STATEMENTS
AT 31 DECEMBER
2009
STATEMENT
OF FINANCIAL
POSITION
PURSUANT TO
CONSOB RESOLUTION
NO. 15519
OF 27 JULY 2006