Chrysler 2009 Annual Report Download - page 168
Download and view the complete annual report
Please find page 168 of the 2009 Chrysler annual report below. You can navigate through the pages in the report by either clicking on the pages listed below, or by using the keyword search tool below to find specific information within the annual report.-
 1
1 -
2
-
3
-
4
-
5
-
6
-
7
-
8
-
9
-
10
-
11
-
12
-
13
-
14
-
15
-
16
-
17
-
18
-
19
-
20
-
21
-
22
-
23
-
24
-
25
-
26
-
27
-
28
-
29
-
30
-
31
-
32
-
33
-
34
-
35
-
36
-
37
-
38
-
39
-
40
-
41
-
42
-
43
-
44
-
45
-
46
-
47
-
48
-
49
-
50
-
51
-
52
-
53
-
54
-
55
-
56
-
57
-
58
-
59
-
60
-
61
-
62
-
63
-
64
-
65
-
66
-
67
-
68
-
69
-
70
-
71
-
72
-
73
-
74
-
75
-
76
-
77
-
78
-
79
-
80
-
81
-
82
-
83
-
84
-
85
-
86
-
87
-
88
-
89
-
90
-
91
-
92
-
93
-
94
-
95
-
96
-
97
-
98
-
99
-
100
-
101
-
102
-
103
-
104
-
105
-
106
-
107
-
108
-
109
-
110
-
111
-
112
-
113
-
114
-
115
-
116
-
117
-
118
-
119
-
120
-
121
-
122
-
123
-
124
-
125
-
126
-
127
-
128
-
129
-
130
-
131
-
132
-
133
-
134
-
135
-
136
-
137
-
138
-
139
-
140
-
141
-
142
-
143
-
144
-
145
-
146
-
147
-
148
-
149
-
150
-
151
-
152
-
153
-
154
-
155
-
156
-
157
-
 158
158 -
 159
159 -
 160
160 -
 161
161 -
 162
162 -
 163
163 -
 164
164 -
 165
165 -
 166
166 -
 167
167 -
 168
168 -
 169
169 -
 170
170 -
 171
171 -
 172
172 -
 173
173 -
 174
174 -
 175
175 -
 176
176 -
 177
177 -
 178
178 -
179
-
180
-
181
-
182
-
183
-
184
-
185
-
186
-
187
-
188
-
189
-
190
-
191
-
192
-
193
-
194
-
195
-
196
-
197
-
198
-
199
-
200
-
201
-
202
-
203
-
204
-
205
-
206
-
207
-
208
-
209
-
210
-
211
-
212
-
213
-
214
-
215
-
216
-
217
-
218
-
219
-
220
-
221
-
222
-
223
-
224
-
225
-
226
-
227
-
228
-
229
-
230
-
231
-
232
-
233
-
234
-
235
-
236
-
237
-
238
-
239
-
240
-
241
-
242
-
243
-
244
-
245
-
246
-
247
-
248
-
249
-
250
-
251
-
252
-
253
-
254
-
255
-
256
-
257
-
258
-
259
-
260
-
261
-
262
-
263
-
264
-
265
-
266
-
267
-
268
-
269
-
270
-
271
-
272
-
273
-
274
-
275
-
276
-
277
-
278
-
279
-
280
-
281
-
282
-
283
-
284
-
285
-
286
-
287
-
288
-
289
-
290
-
291
-
292
-
293
-
294
-
295
-
296
-
297
-
298
-
299
-
300
-
301
-
302
-
303
-
304
-
305
-
306
-
307
-
308
-
309
-
310
-
311
-
312
-
313
-
314
-
315
-
316
-
317
-
318
-
319
-
320
-
321
-
322
-
323
-
324
-
325
-
326
-
327
-
328
-
329
-
330
-
331
-
332
-
333
-
334
-
335
-
336
-
337
-
338
-
339
-
340
-
341
-
342
-
343
-
344
-
345
-
346
-
347
-
348
-
349
-
350
-
351
-
352
-
353
-
354
-
355
-
356
-
357
-
358
-
359
-
360
-
361
-
362
-
363
-
364
-
365
-
366
-
367
-
368
-
369
-
370
-
371
-
372
-
373
-
374
 |
 |

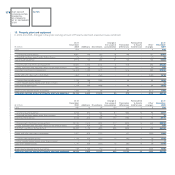
167
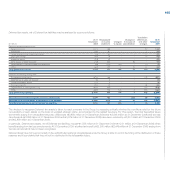
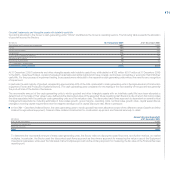
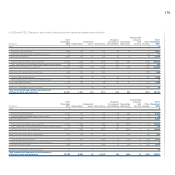
The following table shows the reconciliation between the Profit or loss attributable to owners of the parent and the Profit or loss attributable to each class of
shares, as well as, the weighted average number of outstanding shares for the two years presented:
2009 2008
Ordinary Preference Saving Ordinary Preference Saving
shares shares shares Total shares shares shares Total
Profit/(loss) attributable to owners
of the parent € million
(838) 1,612
Preferred dividends declared for the period € million - - - - - - 25 25
Profit/(loss) available for distribution
to all classes of shares € million (714) (70) (54) (838) 1,363 133 91 1,587
Profit/(loss) attributable to each class
of shares € million (714) (70) (54) (838) 1,363 133 116 1,612
Weighted average number of shares
outstanding thousand 1,053,679 103,292 79,913 1,236,884 1,056,675 103,292 79,913 1,239,880
Basic Earnings/(loss) per share € (0.677) (0.677) (0.677) 1.290 1.290 1.445
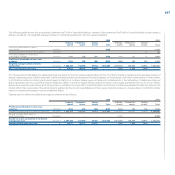
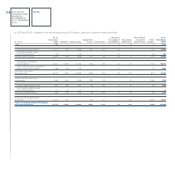
For the purpose of calculating the diluted earnings per share for the two years presented the number of ordinary shares considered is the average number of
shares outstanding plus “dilutive potential” ordinary shares arising from shares that would be issued on the exercise of all stock option plans or other similar.
In 2009 stock option and stock grant plans based on Fiat S.p.A. ordinary shares were not taken into consideration in the calculation of diluted earnings per
share calculation as they would have had an antidilutive effect. In 2008 no dilutive effects arose from stock option plans granted by Fiat S.p.A. on its ordinary
shares at an exercise price above€12.35 per share. In addition, the net profit or loss attributable to the Group in 2008 was adjusted to take into account the
dilutive effect that would arise if the stock options granted by the Group’s subsidiaries on their equity instruments were to be exercised. In 2009 this matter
was not considered because it had an antidilutive effect.
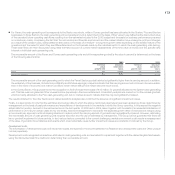
Figures used to determine diluted earnings per shares are as follows:
2009 2008
Ordinary Preference Saving Ordinary Preference Saving
shares shares shares Total shares shares shares Total
Profit/(Loss) attributable to each class
of shares € million (714) (70) (54) (838) 1,364 133 115 1,612
Weighted average number of shares outstanding thousand 1,053,679 103,292 79,913 1,236,884 1,056,675 103,292 79,913 1,239,880
Number of shares deployable for
stock option plans thousand - - - - 5,094 - - 5,094
Number of shares considered in the diluted
earnings per share thousand 1,053,679 103,292 79,913 1,236,884 1,061,769 103,292 79,913 1,244,974
Diluted Earnings/(loss) per share € (0.677) (0.677) (0.677) 1.285 1.285 1.440