Chrysler 2009 Annual Report Download - page 206
Download and view the complete annual report
Please find page 206 of the 2009 Chrysler annual report below. You can navigate through the pages in the report by either clicking on the pages listed below, or by using the keyword search tool below to find specific information within the annual report.-
 1
1 -
2
-
3
-
4
-
5
-
6
-
7
-
8
-
9
-
10
-
11
-
12
-
13
-
14
-
15
-
16
-
17
-
18
-
19
-
20
-
21
-
22
-
23
-
24
-
25
-
26
-
27
-
28
-
29
-
30
-
31
-
32
-
33
-
34
-
35
-
36
-
37
-
38
-
39
-
40
-
41
-
42
-
43
-
44
-
45
-
46
-
47
-
48
-
49
-
50
-
51
-
52
-
53
-
54
-
55
-
56
-
57
-
58
-
59
-
60
-
61
-
62
-
63
-
64
-
65
-
66
-
67
-
68
-
69
-
70
-
71
-
72
-
73
-
74
-
75
-
76
-
77
-
78
-
79
-
80
-
81
-
82
-
83
-
84
-
85
-
86
-
87
-
88
-
89
-
90
-
91
-
92
-
93
-
94
-
95
-
96
-
97
-
98
-
99
-
100
-
101
-
102
-
103
-
104
-
105
-
106
-
107
-
108
-
109
-
110
-
111
-
112
-
113
-
114
-
115
-
116
-
117
-
118
-
119
-
120
-
121
-
122
-
123
-
124
-
125
-
126
-
127
-
128
-
129
-
130
-
131
-
132
-
133
-
134
-
135
-
136
-
137
-
138
-
139
-
140
-
141
-
142
-
143
-
144
-
145
-
146
-
147
-
148
-
149
-
150
-
151
-
152
-
153
-
154
-
155
-
156
-
157
-
158
-
159
-
160
-
161
-
162
-
163
-
164
-
165
-
166
-
167
-
168
-
169
-
170
-
171
-
172
-
173
-
174
-
175
-
176
-
177
-
178
-
179
-
180
-
181
-
182
-
183
-
184
-
185
-
186
-
187
-
188
-
189
-
190
-
191
-
192
-
193
-
194
-
195
-
 196
196 -
 197
197 -
 198
198 -
 199
199 -
 200
200 -
 201
201 -
 202
202 -
 203
203 -
 204
204 -
 205
205 -
 206
206 -
 207
207 -
 208
208 -
 209
209 -
 210
210 -
 211
211 -
 212
212 -
 213
213 -
 214
214 -
 215
215 -
 216
216 -
217
-
218
-
219
-
220
-
221
-
222
-
223
-
224
-
225
-
226
-
227
-
228
-
229
-
230
-
231
-
232
-
233
-
234
-
235
-
236
-
237
-
238
-
239
-
240
-
241
-
242
-
243
-
244
-
245
-
246
-
247
-
248
-
249
-
250
-
251
-
252
-
253
-
254
-
255
-
256
-
257
-
258
-
259
-
260
-
261
-
262
-
263
-
264
-
265
-
266
-
267
-
268
-
269
-
270
-
271
-
272
-
273
-
274
-
275
-
276
-
277
-
278
-
279
-
280
-
281
-
282
-
283
-
284
-
285
-
286
-
287
-
288
-
289
-
290
-
291
-
292
-
293
-
294
-
295
-
296
-
297
-
298
-
299
-
300
-
301
-
302
-
303
-
304
-
305
-
306
-
307
-
308
-
309
-
310
-
311
-
312
-
313
-
314
-
315
-
316
-
317
-
318
-
319
-
320
-
321
-
322
-
323
-
324
-
325
-
326
-
327
-
328
-
329
-
330
-
331
-
332
-
333
-
334
-
335
-
336
-
337
-
338
-
339
-
340
-
341
-
342
-
343
-
344
-
345
-
346
-
347
-
348
-
349
-
350
-
351
-
352
-
353
-
354
-
355
-
356
-
357
-
358
-
359
-
360
-
361
-
362
-
363
-
364
-
365
-
366
-
367
-
368
-
369
-
370
-
371
-
372
-
373
-
374
 |
 |

205
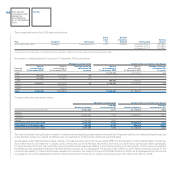
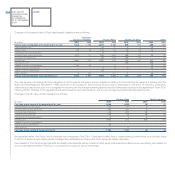
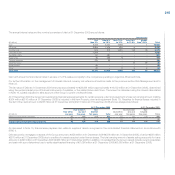
The amounts recognised in the statement of financial position for post-employment benefits at 31 December 2009 and 2008 are as follows:
Employee
severance indemnity Pension Plans Health care plans Other
At 31 At 31 At 31 At 31 At 31 At 31 At 31 At 31
December December December December December December December December
(€ million) 2009 2008 2009 2008 2009 2008 2009 2008
Present value of funded obligations - - 1,876 1,614 754 821 - -
Fair Value of plan assets - - (1,796) (1,554) (46) (39) - -
- - 80 60 708 782 - -
Present value of unfunded obligations 1,001 1,062 692 653 40 27 258 288
Unrecognised actuarial gains (losses) 85 67 (299) (211) 86 49 (5) (10)
Unrecognised past service cost - - - - 10 18 (11) (31)
Unrecognised assets - - 6 6 - - - -
Net liability 1,086 1,129 479 508 844 876 242 247
Amounts at year end:
Liabilities 1,086 1,129 611 616 844 876 242 247
Assets - - (132) (108) - - - -
Net liability 1,086 1,129 479 508 844 876 242 247
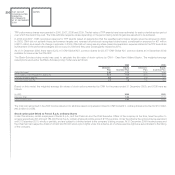
The amounts recognised in the income statement for Post-employment benefits are as follows:
Employee
severance indemnity Pension Plans Health care plans Other
(€ million) 2009 2008 2009 2008 2009 2008 2009 2008
Current service cost - - 23 37 6 5 13 14
Interest costs 55 53 142 147 52 48 14 14
Expected return on plan assets - - (113) (151) (3) (6) - -
Net actuarial losses (gains) recognised - - 23 2 (2) - (1) -
Past service costs - - - 1 (17) (8) 1 2
Paragraph 58 adjustment - - 1 (2) - - - -
Losses (gains) on curtailments and settlements - - 8 (2) 4 - (2) (6)
Total Costs (gains) 55 53 84 32 40 39 25 24
Actual return on plan assets n/a n/a 235 (274) 9 (11) n/a n/a