Chrysler 2009 Annual Report Download - page 58
Download and view the complete annual report
Please find page 58 of the 2009 Chrysler annual report below. You can navigate through the pages in the report by either clicking on the pages listed below, or by using the keyword search tool below to find specific information within the annual report.-
 1
1 -
2
-
3
-
4
-
5
-
6
-
7
-
8
-
9
-
10
-
11
-
12
-
13
-
14
-
15
-
16
-
17
-
18
-
19
-
20
-
21
-
22
-
23
-
24
-
25
-
26
-
27
-
28
-
29
-
30
-
31
-
32
-
33
-
34
-
35
-
36
-
37
-
38
-
39
-
40
-
41
-
42
-
43
-
44
-
45
-
46
-
47
-
 48
48 -
 49
49 -
 50
50 -
 51
51 -
 52
52 -
 53
53 -
 54
54 -
 55
55 -
 56
56 -
 57
57 -
 58
58 -
 59
59 -
 60
60 -
 61
61 -
 62
62 -
 63
63 -
 64
64 -
 65
65 -
 66
66 -
 67
67 -
 68
68 -
69
-
70
-
71
-
72
-
73
-
74
-
75
-
76
-
77
-
78
-
79
-
80
-
81
-
82
-
83
-
84
-
85
-
86
-
87
-
88
-
89
-
90
-
91
-
92
-
93
-
94
-
95
-
96
-
97
-
98
-
99
-
100
-
101
-
102
-
103
-
104
-
105
-
106
-
107
-
108
-
109
-
110
-
111
-
112
-
113
-
114
-
115
-
116
-
117
-
118
-
119
-
120
-
121
-
122
-
123
-
124
-
125
-
126
-
127
-
128
-
129
-
130
-
131
-
132
-
133
-
134
-
135
-
136
-
137
-
138
-
139
-
140
-
141
-
142
-
143
-
144
-
145
-
146
-
147
-
148
-
149
-
150
-
151
-
152
-
153
-
154
-
155
-
156
-
157
-
158
-
159
-
160
-
161
-
162
-
163
-
164
-
165
-
166
-
167
-
168
-
169
-
170
-
171
-
172
-
173
-
174
-
175
-
176
-
177
-
178
-
179
-
180
-
181
-
182
-
183
-
184
-
185
-
186
-
187
-
188
-
189
-
190
-
191
-
192
-
193
-
194
-
195
-
196
-
197
-
198
-
199
-
200
-
201
-
202
-
203
-
204
-
205
-
206
-
207
-
208
-
209
-
210
-
211
-
212
-
213
-
214
-
215
-
216
-
217
-
218
-
219
-
220
-
221
-
222
-
223
-
224
-
225
-
226
-
227
-
228
-
229
-
230
-
231
-
232
-
233
-
234
-
235
-
236
-
237
-
238
-
239
-
240
-
241
-
242
-
243
-
244
-
245
-
246
-
247
-
248
-
249
-
250
-
251
-
252
-
253
-
254
-
255
-
256
-
257
-
258
-
259
-
260
-
261
-
262
-
263
-
264
-
265
-
266
-
267
-
268
-
269
-
270
-
271
-
272
-
273
-
274
-
275
-
276
-
277
-
278
-
279
-
280
-
281
-
282
-
283
-
284
-
285
-
286
-
287
-
288
-
289
-
290
-
291
-
292
-
293
-
294
-
295
-
296
-
297
-
298
-
299
-
300
-
301
-
302
-
303
-
304
-
305
-
306
-
307
-
308
-
309
-
310
-
311
-
312
-
313
-
314
-
315
-
316
-
317
-
318
-
319
-
320
-
321
-
322
-
323
-
324
-
325
-
326
-
327
-
328
-
329
-
330
-
331
-
332
-
333
-
334
-
335
-
336
-
337
-
338
-
339
-
340
-
341
-
342
-
343
-
344
-
345
-
346
-
347
-
348
-
349
-
350
-
351
-
352
-
353
-
354
-
355
-
356
-
357
-
358
-
359
-
360
-
361
-
362
-
363
-
364
-
365
-
366
-
367
-
368
-
369
-
370
-
371
-
372
-
373
-
374
 |
 |

57
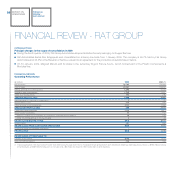
The following review provides an analysis of net revenues and trading profit by individual Business/Sector. Other data relates to the Group as a whole.
Net revenues
Group revenues for 2009 totalled €50,102 million, representing a 15.9% decrease over 2008. Demand was impacted significantly by the global economic
slowdown. The levels of decline experienced in the second half of the year, however, were more contained than for the first six months.
Revenues by Business
(€ million) 2009 2008 (*) % change
Automobiles (Fiat Group Automobiles, Maserati, Ferrari) 28,351 29,380 -3.5
Agricultural and Construction Equipment (CNH – Case New Holland) 10,107 12,781 -20.9
Trucks and Commercial Vehicles (Iveco) 7,183 10,894 -34.1
Components & Production Systems (FPT, Magneti Marelli, Teksid, Comau) 10,327 13,793 -25.1
Other Businesses 1,096 1,394 -21.4
Eliminations (6,962) (8,678) -
Total for the Group 50,102 59,564 -15.9
(*) Following adoption of the improvement to IAS 16 in 2009, amounts for net revenues published in the Consolidated Financial Statements at 31 December 2008 have been adjusted as follows: a
€126 million increase for Trucks and Commercial Vehicles and a €58 million increase for Agricultural and Construction Equipment.
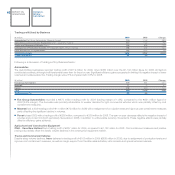
Following is a review of net revenues by Business/Sector:
Automobiles
In 2009, the Automobiles businesses had revenues of €28,351 million, down 3.5% over 2008. Fiat Group Automobiles limited the decrease in revenues
to 2.4%, taking full advantage of the increase in demand which resulted from the introduction of eco-based incentives in several countries. For Ferrari,
revenues were down 7.4% over 2008, a year with particularly high volumes. Maserati, with revenues down 45.7%, was impacted by the significant decline
in demand in its reference market.
(€ million) 2009 2008 % change
Fiat Group Automobiles 26,293 26,937 -2.4
Maserati 448 825 -45.7
Ferrari 1,778 1,921 -7.4
Eliminations (168) (303) -
Total 28,351 29,380 -3.5
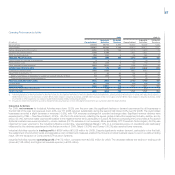
Fiat Group Automobiles posted revenues of €26,293 million, a 2.4% decrease over 2008 (substantially unchanged at constant exchange rates). After
the sharp volume declines experienced in the first half, resulting from the significant contraction in market demand, the Sector achieved year-on-year
volume increases for passenger cars in the second half.
Fiat Group Automobiles delivered a total of 2,150,700 passenger cars and light commercial vehicles for the year, in line with 2008 (2,152,500 units). There
was a significant divergence, however, between performance for passenger cars (+5.7%) and light commercial vehicles (-24.8%).
In Western Europe, total deliveries were unchanged at 1,238,100 units. Performance was positive in Italy (+0.5%) and the UK (+5.2%) and very strong
growth was achieved in Germany (+46.2%). There was a decrease in France (-7.3%) and a sharp decline in Spain (-48.3%), with the latter also impacted
by measures adopted to realign dealer inventory levels to market demand. For Western Europe, passenger car deliveries rose 8.9%, with the level of
demand increasing slightly (+0.5%) over 2008.
Fiat Group Automobiles’ strong offering of environmentally-friendly cars enabled the Sector to fully benefit from eco-based government incentives. The
Sector continued to make positive share gains in the passenger vehicle market, reaching 32.8% in Italy (+0.9 percentage points over 2008) and 8.8% in
Western Europe (+0.6 percentage points). FGA’s relative performance was particularly strong in Germany (+1.5 percentage points to 4.7%) and positive
also in the UK (+0.6 percentage points to 3.5%).