Chrysler 2009 Annual Report Download - page 185
Download and view the complete annual report
Please find page 185 of the 2009 Chrysler annual report below. You can navigate through the pages in the report by either clicking on the pages listed below, or by using the keyword search tool below to find specific information within the annual report.-
 1
1 -
2
-
3
-
4
-
5
-
6
-
7
-
8
-
9
-
10
-
11
-
12
-
13
-
14
-
15
-
16
-
17
-
18
-
19
-
20
-
21
-
22
-
23
-
24
-
25
-
26
-
27
-
28
-
29
-
30
-
31
-
32
-
33
-
34
-
35
-
36
-
37
-
38
-
39
-
40
-
41
-
42
-
43
-
44
-
45
-
46
-
47
-
48
-
49
-
50
-
51
-
52
-
53
-
54
-
55
-
56
-
57
-
58
-
59
-
60
-
61
-
62
-
63
-
64
-
65
-
66
-
67
-
68
-
69
-
70
-
71
-
72
-
73
-
74
-
75
-
76
-
77
-
78
-
79
-
80
-
81
-
82
-
83
-
84
-
85
-
86
-
87
-
88
-
89
-
90
-
91
-
92
-
93
-
94
-
95
-
96
-
97
-
98
-
99
-
100
-
101
-
102
-
103
-
104
-
105
-
106
-
107
-
108
-
109
-
110
-
111
-
112
-
113
-
114
-
115
-
116
-
117
-
118
-
119
-
120
-
121
-
122
-
123
-
124
-
125
-
126
-
127
-
128
-
129
-
130
-
131
-
132
-
133
-
134
-
135
-
136
-
137
-
138
-
139
-
140
-
141
-
142
-
143
-
144
-
145
-
146
-
147
-
148
-
149
-
150
-
151
-
152
-
153
-
154
-
155
-
156
-
157
-
158
-
159
-
160
-
161
-
162
-
163
-
164
-
165
-
166
-
167
-
168
-
169
-
170
-
171
-
172
-
173
-
174
-
 175
175 -
 176
176 -
 177
177 -
 178
178 -
 179
179 -
 180
180 -
 181
181 -
 182
182 -
 183
183 -
 184
184 -
 185
185 -
 186
186 -
 187
187 -
 188
188 -
 189
189 -
 190
190 -
 191
191 -
 192
192 -
 193
193 -
 194
194 -
 195
195 -
196
-
197
-
198
-
199
-
200
-
201
-
202
-
203
-
204
-
205
-
206
-
207
-
208
-
209
-
210
-
211
-
212
-
213
-
214
-
215
-
216
-
217
-
218
-
219
-
220
-
221
-
222
-
223
-
224
-
225
-
226
-
227
-
228
-
229
-
230
-
231
-
232
-
233
-
234
-
235
-
236
-
237
-
238
-
239
-
240
-
241
-
242
-
243
-
244
-
245
-
246
-
247
-
248
-
249
-
250
-
251
-
252
-
253
-
254
-
255
-
256
-
257
-
258
-
259
-
260
-
261
-
262
-
263
-
264
-
265
-
266
-
267
-
268
-
269
-
270
-
271
-
272
-
273
-
274
-
275
-
276
-
277
-
278
-
279
-
280
-
281
-
282
-
283
-
284
-
285
-
286
-
287
-
288
-
289
-
290
-
291
-
292
-
293
-
294
-
295
-
296
-
297
-
298
-
299
-
300
-
301
-
302
-
303
-
304
-
305
-
306
-
307
-
308
-
309
-
310
-
311
-
312
-
313
-
314
-
315
-
316
-
317
-
318
-
319
-
320
-
321
-
322
-
323
-
324
-
325
-
326
-
327
-
328
-
329
-
330
-
331
-
332
-
333
-
334
-
335
-
336
-
337
-
338
-
339
-
340
-
341
-
342
-
343
-
344
-
345
-
346
-
347
-
348
-
349
-
350
-
351
-
352
-
353
-
354
-
355
-
356
-
357
-
358
-
359
-
360
-
361
-
362
-
363
-
364
-
365
-
366
-
367
-
368
-
369
-
370
-
371
-
372
-
373
-
374
 |
 |

184 FIAT GROUP
CONSOLIDATED
FINANCIAL
STATEMENTS
AT 31 DECEMBER
2009
NOTES
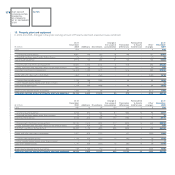
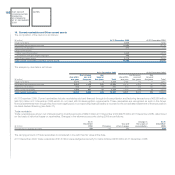
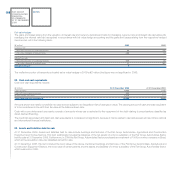
The item may be analysed as follows stated gross of an allowance of€80 million at 31 December 2009 (€75 million at 31 December 2008):
At 31 December 2009 At 31 December 2008
due between due due between due
due within one and beyond due within one and beyond
(€ million) one year five years five years Total one year five years five years Total
Receivables for future minimum lease payments 560 731 76 1,367 438 622 57 1,117
Less: unrealised interest income (61) (104) (12) (177) (60) (86) (11) (157)
Present value of future minimum lease payments 499 627 64 1,190 378 536 46 960
There are no contingent rents as finance lease recognised income during 2009 or 2008 and unguaranteed residual values at 31 December 2009 and 2008
are not significant.
Receivables for dealer financing are typically generated by sales of vehicles and are generally managed under dealer network financing programs as a
component of the portfolio of the financial services companies. These receivables are interest bearing, with the exception of an initial limited, non-interest
bearing period. The contractual terms governing the relationships with the dealer networks vary from Sector to Sector and from country to country, although
these payments terms range from two to six months.
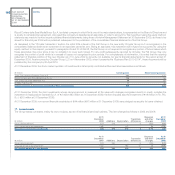
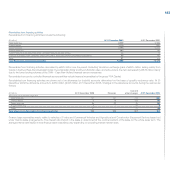
The fair value of receivables from financing activities at 31 December 2009 amounts approximately to€12,876 million (€13,329 million at 31 December
2008) and has been calculated using a discounted cash flow method based on the following discount rates, adjusted, where necessary, to take account of
the specific risk of insolvency of the underlying financial instrument.
In % EUR USD GBP CAD AUD BRL PLN
Interest rate for six months 0.99 0.43 0.84 0.70 4.47 9.19 4.39
Interest rate for one year 1.25 0.98 1.25 1.25 5.24 10.43 4.52
Interest rate for five years 2.84 3.05 3.45 2.91 5.90 12.79 5.80
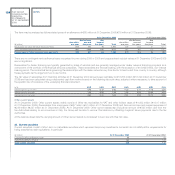
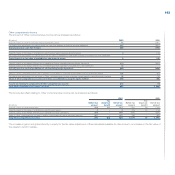
Other current assets
At 31 December 2009, Other current assets mainly consist of Other tax receivables for VAT and other indirect taxes of€1,002 million (€1,617 million
at 31 December 2008), Receivables from employees of€67 million (€51 million at 31 December 2008) and Accrued income and prepaid expenses of
€249 million (€227 million at 31 December 2008). At 31 December 2009, Other current assets also include an amount of€593 million due from the
tax Authorities relating to eco-incentives in Italy; the Group will be able to recover this balance by offsetting it against future payments due to the tax
Authorities.
At the balance sheet date the carrying amount of Other current assets is considered to be in line with their fair value.
Current securities20.
Current securities consist of short-term or marketable securities which represent temporary investments, but which do not satisfy all the requirements for
being classified as cash equivalents. In particular:
(€ million) At 31 December 2009 At 31 December 2008
Current securities available-for-sale 53 43
Current securities for trading 164 134
Total Current securities 217 177