Chrysler 2009 Annual Report Download - page 230
Download and view the complete annual report
Please find page 230 of the 2009 Chrysler annual report below. You can navigate through the pages in the report by either clicking on the pages listed below, or by using the keyword search tool below to find specific information within the annual report.-
 1
1 -
2
-
3
-
4
-
5
-
6
-
7
-
8
-
9
-
10
-
11
-
12
-
13
-
14
-
15
-
16
-
17
-
18
-
19
-
20
-
21
-
22
-
23
-
24
-
25
-
26
-
27
-
28
-
29
-
30
-
31
-
32
-
33
-
34
-
35
-
36
-
37
-
38
-
39
-
40
-
41
-
42
-
43
-
44
-
45
-
46
-
47
-
48
-
49
-
50
-
51
-
52
-
53
-
54
-
55
-
56
-
57
-
58
-
59
-
60
-
61
-
62
-
63
-
64
-
65
-
66
-
67
-
68
-
69
-
70
-
71
-
72
-
73
-
74
-
75
-
76
-
77
-
78
-
79
-
80
-
81
-
82
-
83
-
84
-
85
-
86
-
87
-
88
-
89
-
90
-
91
-
92
-
93
-
94
-
95
-
96
-
97
-
98
-
99
-
100
-
101
-
102
-
103
-
104
-
105
-
106
-
107
-
108
-
109
-
110
-
111
-
112
-
113
-
114
-
115
-
116
-
117
-
118
-
119
-
120
-
121
-
122
-
123
-
124
-
125
-
126
-
127
-
128
-
129
-
130
-
131
-
132
-
133
-
134
-
135
-
136
-
137
-
138
-
139
-
140
-
141
-
142
-
143
-
144
-
145
-
146
-
147
-
148
-
149
-
150
-
151
-
152
-
153
-
154
-
155
-
156
-
157
-
158
-
159
-
160
-
161
-
162
-
163
-
164
-
165
-
166
-
167
-
168
-
169
-
170
-
171
-
172
-
173
-
174
-
175
-
176
-
177
-
178
-
179
-
180
-
181
-
182
-
183
-
184
-
185
-
186
-
187
-
188
-
189
-
190
-
191
-
192
-
193
-
194
-
195
-
196
-
197
-
198
-
199
-
200
-
201
-
202
-
203
-
204
-
205
-
206
-
207
-
208
-
209
-
210
-
211
-
212
-
213
-
214
-
215
-
216
-
217
-
218
-
219
-
 220
220 -
 221
221 -
 222
222 -
 223
223 -
 224
224 -
 225
225 -
 226
226 -
 227
227 -
 228
228 -
 229
229 -
 230
230 -
 231
231 -
 232
232 -
 233
233 -
 234
234 -
 235
235 -
 236
236 -
 237
237 -
 238
238 -
 239
239 -
 240
240 -
241
-
242
-
243
-
244
-
245
-
246
-
247
-
248
-
249
-
250
-
251
-
252
-
253
-
254
-
255
-
256
-
257
-
258
-
259
-
260
-
261
-
262
-
263
-
264
-
265
-
266
-
267
-
268
-
269
-
270
-
271
-
272
-
273
-
274
-
275
-
276
-
277
-
278
-
279
-
280
-
281
-
282
-
283
-
284
-
285
-
286
-
287
-
288
-
289
-
290
-
291
-
292
-
293
-
294
-
295
-
296
-
297
-
298
-
299
-
300
-
301
-
302
-
303
-
304
-
305
-
306
-
307
-
308
-
309
-
310
-
311
-
312
-
313
-
314
-
315
-
316
-
317
-
318
-
319
-
320
-
321
-
322
-
323
-
324
-
325
-
326
-
327
-
328
-
329
-
330
-
331
-
332
-
333
-
334
-
335
-
336
-
337
-
338
-
339
-
340
-
341
-
342
-
343
-
344
-
345
-
346
-
347
-
348
-
349
-
350
-
351
-
352
-
353
-
354
-
355
-
356
-
357
-
358
-
359
-
360
-
361
-
362
-
363
-
364
-
365
-
366
-
367
-
368
-
369
-
370
-
371
-
372
-
373
-
374
 |
 |

229
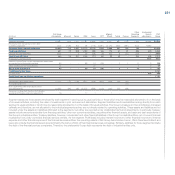
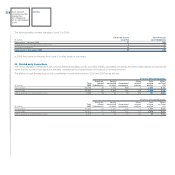
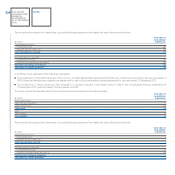
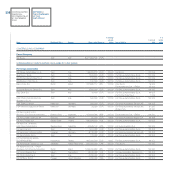
The effects on the consolidated statement of financial position at 31 December 2009 and 2008 are as follows:
of which: with related parties
At 31 Unconso- Jointly Other Total Effect
December lidated controlled Associated related related on Total
(€ million) 2009 Subsidiaries entities companies parties parties (%)
Other investments and non current financial assets 275 39 39 17 - 95 34.5%
Inventories 8,748 - - 10 - 10 0.1%
Trade receivables 3,649 33 469 93 - 595 16.3%
Current receivables from financing activities 12,695 51 62 2 5 120 0.9%
Current tax receivables 674 - - - - - -
Other current assets 2,778 6 36 1 22 65 2.3%
Current financial assets 899 - - - 52 52 5.8%
Cash and cash equivalents 12,226 - - - 651 651 5.3%
Asset-backed financing 7,086 - 96 216 174 486 6.9%
Other debt 21,441 40 209 38 371 658 3.1%
Other financial liabilities 464 - - - 49 49 10.6%
Trade payables 12,295 25 793 39 29 886 7.2%
Current tax payables 377 - - - - - -
Other current liabilities 5,865 4 166 4 7 181 3.1%
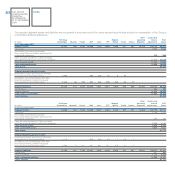
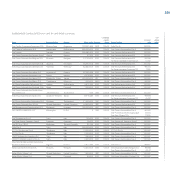
of which: with related parties
At 31 Unconso- Jointly Other Total Effect
December lidated controlled Associated related related on Total
(€ million) 2009 Subsidiaries entities companies parties parties (%)
Other investments and non current financial assets 278 32 - 16 - 48 17.3%
Inventories 11,438 - 2 - - 2 -
Trade receivables 4,390 32 462 132 1 627 14.3%
Current receivables from financing activities 13,136 14 114 4 2 134 1.0%
Current tax receivables 770 2 - - - 2 0.3%
Other current assets 2,600 7 20 - 24 51 2.0%
Current financial assets 967 - - - 46 46 4.8%
Cash and cash equivalents 3,683 - - - 101 101 2.7%
Asset-backed financing 6,663 - 116 143 20 279 4.2%
Other debt 14,716 35 242 47 170 494 3.4%
Other financial liabilities 1,202 - - - 95 95 7.9%
Trade payables 13,258 12 961 59 19 1,051 7.9%
Current tax payables 331 2 - - - 2 0.6%
Other current liabilities 6,185 - 150 - 3 153 2.5%
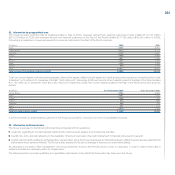
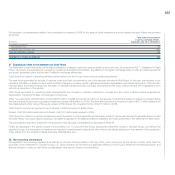
Transactions with jointly controlled entities
These transactions affected revenues, cost of sales, trade receivables and payables, current receivables from financing activities, asset backed-financing,
other financial payables. The effects arising on the financial statements are set out as follows.