Chrysler 2009 Annual Report Download - page 228
Download and view the complete annual report
Please find page 228 of the 2009 Chrysler annual report below. You can navigate through the pages in the report by either clicking on the pages listed below, or by using the keyword search tool below to find specific information within the annual report.-
 1
1 -
2
-
3
-
4
-
5
-
6
-
7
-
8
-
9
-
10
-
11
-
12
-
13
-
14
-
15
-
16
-
17
-
18
-
19
-
20
-
21
-
22
-
23
-
24
-
25
-
26
-
27
-
28
-
29
-
30
-
31
-
32
-
33
-
34
-
35
-
36
-
37
-
38
-
39
-
40
-
41
-
42
-
43
-
44
-
45
-
46
-
47
-
48
-
49
-
50
-
51
-
52
-
53
-
54
-
55
-
56
-
57
-
58
-
59
-
60
-
61
-
62
-
63
-
64
-
65
-
66
-
67
-
68
-
69
-
70
-
71
-
72
-
73
-
74
-
75
-
76
-
77
-
78
-
79
-
80
-
81
-
82
-
83
-
84
-
85
-
86
-
87
-
88
-
89
-
90
-
91
-
92
-
93
-
94
-
95
-
96
-
97
-
98
-
99
-
100
-
101
-
102
-
103
-
104
-
105
-
106
-
107
-
108
-
109
-
110
-
111
-
112
-
113
-
114
-
115
-
116
-
117
-
118
-
119
-
120
-
121
-
122
-
123
-
124
-
125
-
126
-
127
-
128
-
129
-
130
-
131
-
132
-
133
-
134
-
135
-
136
-
137
-
138
-
139
-
140
-
141
-
142
-
143
-
144
-
145
-
146
-
147
-
148
-
149
-
150
-
151
-
152
-
153
-
154
-
155
-
156
-
157
-
158
-
159
-
160
-
161
-
162
-
163
-
164
-
165
-
166
-
167
-
168
-
169
-
170
-
171
-
172
-
173
-
174
-
175
-
176
-
177
-
178
-
179
-
180
-
181
-
182
-
183
-
184
-
185
-
186
-
187
-
188
-
189
-
190
-
191
-
192
-
193
-
194
-
195
-
196
-
197
-
198
-
199
-
200
-
201
-
202
-
203
-
204
-
205
-
206
-
207
-
208
-
209
-
210
-
211
-
212
-
213
-
214
-
215
-
216
-
217
-
 218
218 -
 219
219 -
 220
220 -
 221
221 -
 222
222 -
 223
223 -
 224
224 -
 225
225 -
 226
226 -
 227
227 -
 228
228 -
 229
229 -
 230
230 -
 231
231 -
 232
232 -
 233
233 -
 234
234 -
 235
235 -
 236
236 -
 237
237 -
 238
238 -
239
-
240
-
241
-
242
-
243
-
244
-
245
-
246
-
247
-
248
-
249
-
250
-
251
-
252
-
253
-
254
-
255
-
256
-
257
-
258
-
259
-
260
-
261
-
262
-
263
-
264
-
265
-
266
-
267
-
268
-
269
-
270
-
271
-
272
-
273
-
274
-
275
-
276
-
277
-
278
-
279
-
280
-
281
-
282
-
283
-
284
-
285
-
286
-
287
-
288
-
289
-
290
-
291
-
292
-
293
-
294
-
295
-
296
-
297
-
298
-
299
-
300
-
301
-
302
-
303
-
304
-
305
-
306
-
307
-
308
-
309
-
310
-
311
-
312
-
313
-
314
-
315
-
316
-
317
-
318
-
319
-
320
-
321
-
322
-
323
-
324
-
325
-
326
-
327
-
328
-
329
-
330
-
331
-
332
-
333
-
334
-
335
-
336
-
337
-
338
-
339
-
340
-
341
-
342
-
343
-
344
-
345
-
346
-
347
-
348
-
349
-
350
-
351
-
352
-
353
-
354
-
355
-
356
-
357
-
358
-
359
-
360
-
361
-
362
-
363
-
364
-
365
-
366
-
367
-
368
-
369
-
370
-
371
-
372
-
373
-
374
 |
 |

227
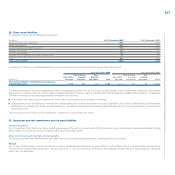
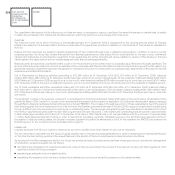
Other risks on derivative financial instruments
As described in Note 21, the Group holds certain derivative financial instruments whose value is linked to the price of listed shares and stock market indices
(principally Equity swaps on Fiat shares).
Although theses transactions were entered into for hedging purposes, they do not qualify for hedge accounting under IFRS. As a consequence, the variability
of the underlying values could have an effect on the Group’s net profit/(loss).
In addition the Group entered derivatives contracts linked to commodity prices to hedge specific exposures on supply contracts.
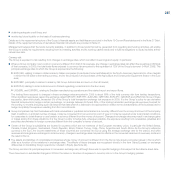
Sensitivity analysis
In the event of a hypothetical, unfavourable and instantaneous change of 10% in the underlying values, the potential loss in fair value of outstanding derivative
financial instruments at 31 December 2009 linked to the Fiat share price would be approximately €21 million (€9 million at 31 December 2008). The increase
over the previous year is due to the different price of the share at the end of the year (which is used as a basis for the simulation).
In the event of a hypothetical, unfavourable and instantaneous change of 10% in the underlying raw materials prices, the potential loss in fair value of
outstanding derivative financial instruments at 31 December 2008 linked to commodity prices would be approximately €3 million (€1 million at 31 December
2008).
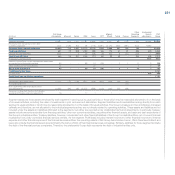
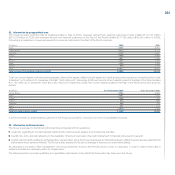
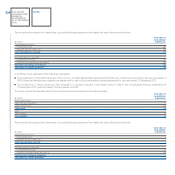
Fair value hierarchy34.
IFRS 7 requires financial instruments recognised in the statement of financial position at fair value to be classified on the basis of a hierarchy that reflects the
significance of the inputs used in determining fair value. The following levels are used in this hierarchy:
Level 1 – quoted prices in active markets for the assets or liabilities being measured;
Level 2 – inputs other than quoted prices included within Level 1 that are observable for the asset or liability, either directly (as prices) or indirectly (derived
from prices) on the market;
Level 3 – inputs that are not based on observable market data.
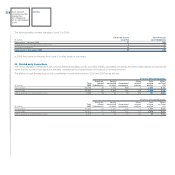
The following table provides an analysis under this hierarchy of financial assets and liabilities measured at fair value at 31 December 2009.
(€ million) Note Level 1 Level 2 Level 3 Total
Assets at fair value with changes directly in equity:
Investments at fair value with changes directly in equity (16) 3 18 - 21
Other Non current securities (16) 4 - 27 31
Current securities available for sale (20) 53 - - 53
Financial assets at fair value held for trading:
Current investments 46 - - 46
Current securities held for trading (20) 164 - - 164
Other financial assets (21) - 635 1 636
Total Assets 270 653 28 951
Other financial liabilities (21) - (445) (19) (464)
Total Liabilities - (445) (19) (464)
In 2009 there were no transfers from Level 1 to Level 2 or vice versa.