Chrysler 2009 Annual Report Download - page 115
Download and view the complete annual report
Please find page 115 of the 2009 Chrysler annual report below. You can navigate through the pages in the report by either clicking on the pages listed below, or by using the keyword search tool below to find specific information within the annual report.-
 1
1 -
2
-
3
-
4
-
5
-
6
-
7
-
8
-
9
-
10
-
11
-
12
-
13
-
14
-
15
-
16
-
17
-
18
-
19
-
20
-
21
-
22
-
23
-
24
-
25
-
26
-
27
-
28
-
29
-
30
-
31
-
32
-
33
-
34
-
35
-
36
-
37
-
38
-
39
-
40
-
41
-
42
-
43
-
44
-
45
-
46
-
47
-
48
-
49
-
50
-
51
-
52
-
53
-
54
-
55
-
56
-
57
-
58
-
59
-
60
-
61
-
62
-
63
-
64
-
65
-
66
-
67
-
68
-
69
-
70
-
71
-
72
-
73
-
74
-
75
-
76
-
77
-
78
-
79
-
80
-
81
-
82
-
83
-
84
-
85
-
86
-
87
-
88
-
89
-
90
-
91
-
92
-
93
-
94
-
95
-
96
-
97
-
98
-
99
-
100
-
101
-
102
-
103
-
104
-
 105
105 -
 106
106 -
 107
107 -
 108
108 -
 109
109 -
 110
110 -
 111
111 -
 112
112 -
 113
113 -
 114
114 -
 115
115 -
 116
116 -
 117
117 -
 118
118 -
 119
119 -
 120
120 -
 121
121 -
 122
122 -
 123
123 -
 124
124 -
 125
125 -
126
-
127
-
128
-
129
-
130
-
131
-
132
-
133
-
134
-
135
-
136
-
137
-
138
-
139
-
140
-
141
-
142
-
143
-
144
-
145
-
146
-
147
-
148
-
149
-
150
-
151
-
152
-
153
-
154
-
155
-
156
-
157
-
158
-
159
-
160
-
161
-
162
-
163
-
164
-
165
-
166
-
167
-
168
-
169
-
170
-
171
-
172
-
173
-
174
-
175
-
176
-
177
-
178
-
179
-
180
-
181
-
182
-
183
-
184
-
185
-
186
-
187
-
188
-
189
-
190
-
191
-
192
-
193
-
194
-
195
-
196
-
197
-
198
-
199
-
200
-
201
-
202
-
203
-
204
-
205
-
206
-
207
-
208
-
209
-
210
-
211
-
212
-
213
-
214
-
215
-
216
-
217
-
218
-
219
-
220
-
221
-
222
-
223
-
224
-
225
-
226
-
227
-
228
-
229
-
230
-
231
-
232
-
233
-
234
-
235
-
236
-
237
-
238
-
239
-
240
-
241
-
242
-
243
-
244
-
245
-
246
-
247
-
248
-
249
-
250
-
251
-
252
-
253
-
254
-
255
-
256
-
257
-
258
-
259
-
260
-
261
-
262
-
263
-
264
-
265
-
266
-
267
-
268
-
269
-
270
-
271
-
272
-
273
-
274
-
275
-
276
-
277
-
278
-
279
-
280
-
281
-
282
-
283
-
284
-
285
-
286
-
287
-
288
-
289
-
290
-
291
-
292
-
293
-
294
-
295
-
296
-
297
-
298
-
299
-
300
-
301
-
302
-
303
-
304
-
305
-
306
-
307
-
308
-
309
-
310
-
311
-
312
-
313
-
314
-
315
-
316
-
317
-
318
-
319
-
320
-
321
-
322
-
323
-
324
-
325
-
326
-
327
-
328
-
329
-
330
-
331
-
332
-
333
-
334
-
335
-
336
-
337
-
338
-
339
-
340
-
341
-
342
-
343
-
344
-
345
-
346
-
347
-
348
-
349
-
350
-
351
-
352
-
353
-
354
-
355
-
356
-
357
-
358
-
359
-
360
-
361
-
362
-
363
-
364
-
365
-
366
-
367
-
368
-
369
-
370
-
371
-
372
-
373
-
374
 |
 |
REPORT ON
OPERATIONS
OPERATING
PERFORMANCE
BY SECTOR
114
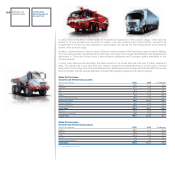
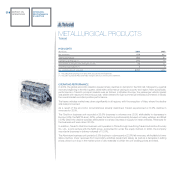
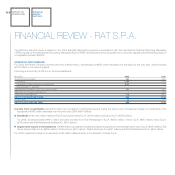
METALLURGICAL PRODUCTS
Teksid
HIGHLIGHTS
(E million) 2009 2008
Net revenues 578 837
Trading profit/(loss) (12) 41
Operating profit/(loss) (*) (14) 49
Investments in tangible and intangible assets 33 41
Total R&D expenditure (**) 2 3
No. of employees at year end 6,194 7,600
(*) Including restructuring costs and other unusual income/(expense).
(**) Includes capitalised R&D and R&D charged directly to the income statement.
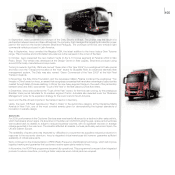
OPERATING PERFORMANCE
In 2009, the global economic situation caused sharp declines in demand in the first half, followed by a partial
recovery beginning in the third quarter, albeit with performance varying by country and region. More specifically,
performance in Teksid’s principal markets was as follows: in Western Europe, the passenger vehicle market
was stable with respect to the previous year, while demand for light commercial vehicles plummeted; in Brazil,
the overall market recorded positive performance.
The heavy vehicles market was down significantly in all regions, with the exception of Asia, where the decline
was less pronounced.
As a result of the economic circumstances already described, Teksid experienced a 30.9% decline in
revenues for 2009.
The Cast Iron business unit recorded a 26.6% decrease in volumes over 2008, attributable to decreases in
Europe (-9%), the NAFTA area (-52%), where the Sector is predominantly focused on heavy vehicles, and Brazil
(-30%) where the decline was also attributable to a sharp decrease in supply for heavy vehicles. Revenues for
the business unit were down 32.3%.
In addition, Teksid’s Cast Iron business unit operates in China through Hua Dong Teksid Automotive Foundry
Co. Ltd., a joint venture with the SAIC group, accounted for under the equity method. In 2009, the company
recorded a decrease in delivery volumes of 12.5%.
The Aluminium business unit posted a 5.5% decline in volumes and a 22.8% fall revenues, attributable to lower
sales volumes, lower revenues from secondary activities (equipment sales), as well as a decrease in selling
prices driven by a drop in the market price of raw materials to which the unit’s selling prices are linked.