Chrysler 2009 Annual Report Download - page 201
Download and view the complete annual report
Please find page 201 of the 2009 Chrysler annual report below. You can navigate through the pages in the report by either clicking on the pages listed below, or by using the keyword search tool below to find specific information within the annual report.-
 1
1 -
2
-
3
-
4
-
5
-
6
-
7
-
8
-
9
-
10
-
11
-
12
-
13
-
14
-
15
-
16
-
17
-
18
-
19
-
20
-
21
-
22
-
23
-
24
-
25
-
26
-
27
-
28
-
29
-
30
-
31
-
32
-
33
-
34
-
35
-
36
-
37
-
38
-
39
-
40
-
41
-
42
-
43
-
44
-
45
-
46
-
47
-
48
-
49
-
50
-
51
-
52
-
53
-
54
-
55
-
56
-
57
-
58
-
59
-
60
-
61
-
62
-
63
-
64
-
65
-
66
-
67
-
68
-
69
-
70
-
71
-
72
-
73
-
74
-
75
-
76
-
77
-
78
-
79
-
80
-
81
-
82
-
83
-
84
-
85
-
86
-
87
-
88
-
89
-
90
-
91
-
92
-
93
-
94
-
95
-
96
-
97
-
98
-
99
-
100
-
101
-
102
-
103
-
104
-
105
-
106
-
107
-
108
-
109
-
110
-
111
-
112
-
113
-
114
-
115
-
116
-
117
-
118
-
119
-
120
-
121
-
122
-
123
-
124
-
125
-
126
-
127
-
128
-
129
-
130
-
131
-
132
-
133
-
134
-
135
-
136
-
137
-
138
-
139
-
140
-
141
-
142
-
143
-
144
-
145
-
146
-
147
-
148
-
149
-
150
-
151
-
152
-
153
-
154
-
155
-
156
-
157
-
158
-
159
-
160
-
161
-
162
-
163
-
164
-
165
-
166
-
167
-
168
-
169
-
170
-
171
-
172
-
173
-
174
-
175
-
176
-
177
-
178
-
179
-
180
-
181
-
182
-
183
-
184
-
185
-
186
-
187
-
188
-
189
-
190
-
 191
191 -
 192
192 -
 193
193 -
 194
194 -
 195
195 -
 196
196 -
 197
197 -
 198
198 -
 199
199 -
 200
200 -
 201
201 -
 202
202 -
 203
203 -
 204
204 -
 205
205 -
 206
206 -
 207
207 -
 208
208 -
 209
209 -
 210
210 -
 211
211 -
212
-
213
-
214
-
215
-
216
-
217
-
218
-
219
-
220
-
221
-
222
-
223
-
224
-
225
-
226
-
227
-
228
-
229
-
230
-
231
-
232
-
233
-
234
-
235
-
236
-
237
-
238
-
239
-
240
-
241
-
242
-
243
-
244
-
245
-
246
-
247
-
248
-
249
-
250
-
251
-
252
-
253
-
254
-
255
-
256
-
257
-
258
-
259
-
260
-
261
-
262
-
263
-
264
-
265
-
266
-
267
-
268
-
269
-
270
-
271
-
272
-
273
-
274
-
275
-
276
-
277
-
278
-
279
-
280
-
281
-
282
-
283
-
284
-
285
-
286
-
287
-
288
-
289
-
290
-
291
-
292
-
293
-
294
-
295
-
296
-
297
-
298
-
299
-
300
-
301
-
302
-
303
-
304
-
305
-
306
-
307
-
308
-
309
-
310
-
311
-
312
-
313
-
314
-
315
-
316
-
317
-
318
-
319
-
320
-
321
-
322
-
323
-
324
-
325
-
326
-
327
-
328
-
329
-
330
-
331
-
332
-
333
-
334
-
335
-
336
-
337
-
338
-
339
-
340
-
341
-
342
-
343
-
344
-
345
-
346
-
347
-
348
-
349
-
350
-
351
-
352
-
353
-
354
-
355
-
356
-
357
-
358
-
359
-
360
-
361
-
362
-
363
-
364
-
365
-
366
-
367
-
368
-
369
-
370
-
371
-
372
-
373
-
374
 |
 |

200 FIAT GROUP
CONSOLIDATED
FINANCIAL
STATEMENTS
AT 31 DECEMBER
2009
NOTES
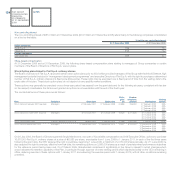
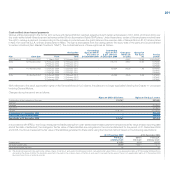
TPP performance shares were granted in 2006, 2007, 2008 and 2009. The fair value of TPP awards have been estimated for each potential service period
over which the award may vest. The total estimated expense varies depending on the period during which targets are expected to be achieved.
In 2006 and 2007, CNH recognised expense for TPP awards based an assumption that the specified performance targets would be achieved in 2009.
In 2008, CNH did not achieve these performance targets and reversed all previously recognised share-based compensation expense for €7 million
(US$11 million) as a result of a change in estimate. In 2009, CNH did not recognise any share-based compensation expense related to the TPP awards as
achievement of the performance targets did not occur in 2009 and they were consequently revised for 2010.
As of 31 December 2009, there were 8,332,115 CNH Global N.V. common shares (9,433,477 CNH Global N.V. common shares at 31 December 2008)
available for issue under the CNH EIP.
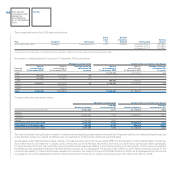
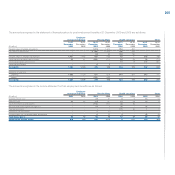
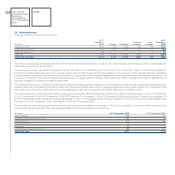
The Black-Scholes pricing model was used to calculate the fair value of stock options by CNH – Case New Holland Sector. The weighted-average
assumptions used under the Black-Scholes pricing model were as follows:
2009 2008
Directors’ Equity Directors’ Equity
Plan Incentive Plan Plan Incentive Plan
Option life (years) 5.00 3.73 5.00 3.59
Price volatility of CNH Global N.V. shares (%) 62.9 70.6 45.0 40.5
Expected dividend yield (%) 0.8 0.7 0.9 0.9
Risk-free interest rate (%) 2.2 1.6 2.4 3.0
Based on this model, the weighted-average fair values of stock options awarded by CNH for the years ended 31 December 2009, and 2008 were as
follows:
(in USD) 2009 2008
Directors’ Plan 8.03 11.70
Equity incentive plan 9.03 12.95
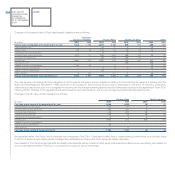
The total cost recognised in the 2009 income statement for all share-based compensation linked to CNH Global N.V. ordinary shares amounted to €10 million
(€0.2 million in 2008).
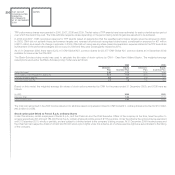
Stock option plan linked to Ferrari S.p.A. ordinary shares
Under this scheme, certain employees of Ferrari S.p.A., and the Chairman and the Chief Executive Officer of the company at the time, have the option to
acquire respectively 207,200 and 184,000 Ferrari S.p.A. ordinary shares at a strike price of €175 per share. Under the scheme the options may be exercised
until 31 December 2010, wholly or partially, and are subject to a limited extent to the company’s listing process. At 31 December 2009 the employees and
the Chairman held respective totals of 43,900 and 80,000 stock option rights under this scheme, all of whose exercise rights are subordinated to the listing
of the company.