Chrysler 2009 Annual Report Download - page 61
Download and view the complete annual report
Please find page 61 of the 2009 Chrysler annual report below. You can navigate through the pages in the report by either clicking on the pages listed below, or by using the keyword search tool below to find specific information within the annual report.-
 1
1 -
2
-
3
-
4
-
5
-
6
-
7
-
8
-
9
-
10
-
11
-
12
-
13
-
14
-
15
-
16
-
17
-
18
-
19
-
20
-
21
-
22
-
23
-
24
-
25
-
26
-
27
-
28
-
29
-
30
-
31
-
32
-
33
-
34
-
35
-
36
-
37
-
38
-
39
-
40
-
41
-
42
-
43
-
44
-
45
-
46
-
47
-
48
-
49
-
50
-
 51
51 -
 52
52 -
 53
53 -
 54
54 -
 55
55 -
 56
56 -
 57
57 -
 58
58 -
 59
59 -
 60
60 -
 61
61 -
 62
62 -
 63
63 -
 64
64 -
 65
65 -
 66
66 -
 67
67 -
 68
68 -
 69
69 -
 70
70 -
 71
71 -
72
-
73
-
74
-
75
-
76
-
77
-
78
-
79
-
80
-
81
-
82
-
83
-
84
-
85
-
86
-
87
-
88
-
89
-
90
-
91
-
92
-
93
-
94
-
95
-
96
-
97
-
98
-
99
-
100
-
101
-
102
-
103
-
104
-
105
-
106
-
107
-
108
-
109
-
110
-
111
-
112
-
113
-
114
-
115
-
116
-
117
-
118
-
119
-
120
-
121
-
122
-
123
-
124
-
125
-
126
-
127
-
128
-
129
-
130
-
131
-
132
-
133
-
134
-
135
-
136
-
137
-
138
-
139
-
140
-
141
-
142
-
143
-
144
-
145
-
146
-
147
-
148
-
149
-
150
-
151
-
152
-
153
-
154
-
155
-
156
-
157
-
158
-
159
-
160
-
161
-
162
-
163
-
164
-
165
-
166
-
167
-
168
-
169
-
170
-
171
-
172
-
173
-
174
-
175
-
176
-
177
-
178
-
179
-
180
-
181
-
182
-
183
-
184
-
185
-
186
-
187
-
188
-
189
-
190
-
191
-
192
-
193
-
194
-
195
-
196
-
197
-
198
-
199
-
200
-
201
-
202
-
203
-
204
-
205
-
206
-
207
-
208
-
209
-
210
-
211
-
212
-
213
-
214
-
215
-
216
-
217
-
218
-
219
-
220
-
221
-
222
-
223
-
224
-
225
-
226
-
227
-
228
-
229
-
230
-
231
-
232
-
233
-
234
-
235
-
236
-
237
-
238
-
239
-
240
-
241
-
242
-
243
-
244
-
245
-
246
-
247
-
248
-
249
-
250
-
251
-
252
-
253
-
254
-
255
-
256
-
257
-
258
-
259
-
260
-
261
-
262
-
263
-
264
-
265
-
266
-
267
-
268
-
269
-
270
-
271
-
272
-
273
-
274
-
275
-
276
-
277
-
278
-
279
-
280
-
281
-
282
-
283
-
284
-
285
-
286
-
287
-
288
-
289
-
290
-
291
-
292
-
293
-
294
-
295
-
296
-
297
-
298
-
299
-
300
-
301
-
302
-
303
-
304
-
305
-
306
-
307
-
308
-
309
-
310
-
311
-
312
-
313
-
314
-
315
-
316
-
317
-
318
-
319
-
320
-
321
-
322
-
323
-
324
-
325
-
326
-
327
-
328
-
329
-
330
-
331
-
332
-
333
-
334
-
335
-
336
-
337
-
338
-
339
-
340
-
341
-
342
-
343
-
344
-
345
-
346
-
347
-
348
-
349
-
350
-
351
-
352
-
353
-
354
-
355
-
356
-
357
-
358
-
359
-
360
-
361
-
362
-
363
-
364
-
365
-
366
-
367
-
368
-
369
-
370
-
371
-
372
-
373
-
374
 |
 |

REPORT ON
OPERATIONS
FINANCIAL
REVIEW -
FIAT GROUP
60
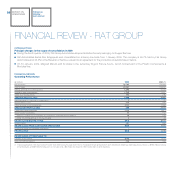
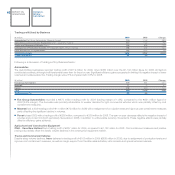
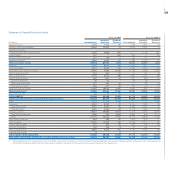
Trading profit/(loss) by Business
(€ million) 2009 2008 Change
Automobiles (Fiat Group Automobiles, Maserati, Ferrari) 719 1,102 -383
Agricultural and Construction Equipment (CNH – Case New Holland) 337 1,122 -785
Trucks and Commercial Vehicles (Iveco) 105 838 -733
Components & Production Systems (FPT, Magneti Marelli, Teksid, Comau) (40) 402 -442
Other Businesses and Eliminations (63) (102) 39
Total for the Group 1,058 3,362 -2,304
Trading margin (%) 2.1 5.6
Following is a discussion of trading profit by Business/Sector:
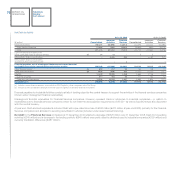
Automobiles
The Automobiles businesses reported trading profit of €719 million for 2009, down €383 million over the €1,102 million figure for 2008. All Sectors
contributed positively, although profit levels were lower than for the prior year. Significant efficiency gains succeeded in limiting the negative impact of lower
volumes and unfavourable mix. Trading margin was 2.5% compared with 3.8% for 2008.
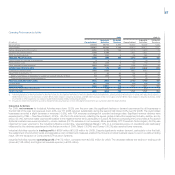
(€ million) 2009 2008 Change
Fiat Group Automobiles 470 691 -221
Maserati 11 72 -61
Ferrari 238 339 -101
Total 719 1,102 -383
Trading margin (%) 2.5 3.8
Fiat Group Automobiles recorded a €470 million trading profit for 2009 (trading margin of 1.8%), compared to the €691 million figure for
2008 (2.6% margin). The decrease was primarily attributable to weaker demand for light commercial vehicles which was partially offset by cost
containment measures.
Maserati had a 2009 trading profit of €11 million (€72 million for 2008) with a realignment of production levels and rigorous cost containment measures
partly offsetting the significant decline in volumes.
Ferrari closed 2009 with a trading profit of €238 million, compared to €339 million for 2008. The year-on-year decrease reflects the negative impact of
volumes and product mix (both particularly favourable in 2008), in addition to unfavourable currency movements. These negative effects were partially
offset by efficiency gains achieved.
Agricultural and Construction Equipment
CNH – Case New Holland had a trading profit of €337 million for 2009, compared to €1,122 million for 2008. Cost containment measures and positive
pricing only partially offset the drastic volume declines in the construction equipment market.
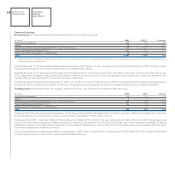
Trucks and Commercial Vehicles
Despite steep volume declines, Iveco delivered a trading profit of €105 million in 2009 (€838 million in 2008), due to realignment of production levels and
rigorous cost containment measures, as well as margin support from the after-sales activities, Latin America and special vehicles business.