Chrysler 2009 Annual Report Download - page 227
Download and view the complete annual report
Please find page 227 of the 2009 Chrysler annual report below. You can navigate through the pages in the report by either clicking on the pages listed below, or by using the keyword search tool below to find specific information within the annual report.-
 1
1 -
2
-
3
-
4
-
5
-
6
-
7
-
8
-
9
-
10
-
11
-
12
-
13
-
14
-
15
-
16
-
17
-
18
-
19
-
20
-
21
-
22
-
23
-
24
-
25
-
26
-
27
-
28
-
29
-
30
-
31
-
32
-
33
-
34
-
35
-
36
-
37
-
38
-
39
-
40
-
41
-
42
-
43
-
44
-
45
-
46
-
47
-
48
-
49
-
50
-
51
-
52
-
53
-
54
-
55
-
56
-
57
-
58
-
59
-
60
-
61
-
62
-
63
-
64
-
65
-
66
-
67
-
68
-
69
-
70
-
71
-
72
-
73
-
74
-
75
-
76
-
77
-
78
-
79
-
80
-
81
-
82
-
83
-
84
-
85
-
86
-
87
-
88
-
89
-
90
-
91
-
92
-
93
-
94
-
95
-
96
-
97
-
98
-
99
-
100
-
101
-
102
-
103
-
104
-
105
-
106
-
107
-
108
-
109
-
110
-
111
-
112
-
113
-
114
-
115
-
116
-
117
-
118
-
119
-
120
-
121
-
122
-
123
-
124
-
125
-
126
-
127
-
128
-
129
-
130
-
131
-
132
-
133
-
134
-
135
-
136
-
137
-
138
-
139
-
140
-
141
-
142
-
143
-
144
-
145
-
146
-
147
-
148
-
149
-
150
-
151
-
152
-
153
-
154
-
155
-
156
-
157
-
158
-
159
-
160
-
161
-
162
-
163
-
164
-
165
-
166
-
167
-
168
-
169
-
170
-
171
-
172
-
173
-
174
-
175
-
176
-
177
-
178
-
179
-
180
-
181
-
182
-
183
-
184
-
185
-
186
-
187
-
188
-
189
-
190
-
191
-
192
-
193
-
194
-
195
-
196
-
197
-
198
-
199
-
200
-
201
-
202
-
203
-
204
-
205
-
206
-
207
-
208
-
209
-
210
-
211
-
212
-
213
-
214
-
215
-
216
-
 217
217 -
 218
218 -
 219
219 -
 220
220 -
 221
221 -
 222
222 -
 223
223 -
 224
224 -
 225
225 -
 226
226 -
 227
227 -
 228
228 -
 229
229 -
 230
230 -
 231
231 -
 232
232 -
 233
233 -
 234
234 -
 235
235 -
 236
236 -
 237
237 -
238
-
239
-
240
-
241
-
242
-
243
-
244
-
245
-
246
-
247
-
248
-
249
-
250
-
251
-
252
-
253
-
254
-
255
-
256
-
257
-
258
-
259
-
260
-
261
-
262
-
263
-
264
-
265
-
266
-
267
-
268
-
269
-
270
-
271
-
272
-
273
-
274
-
275
-
276
-
277
-
278
-
279
-
280
-
281
-
282
-
283
-
284
-
285
-
286
-
287
-
288
-
289
-
290
-
291
-
292
-
293
-
294
-
295
-
296
-
297
-
298
-
299
-
300
-
301
-
302
-
303
-
304
-
305
-
306
-
307
-
308
-
309
-
310
-
311
-
312
-
313
-
314
-
315
-
316
-
317
-
318
-
319
-
320
-
321
-
322
-
323
-
324
-
325
-
326
-
327
-
328
-
329
-
330
-
331
-
332
-
333
-
334
-
335
-
336
-
337
-
338
-
339
-
340
-
341
-
342
-
343
-
344
-
345
-
346
-
347
-
348
-
349
-
350
-
351
-
352
-
353
-
354
-
355
-
356
-
357
-
358
-
359
-
360
-
361
-
362
-
363
-
364
-
365
-
366
-
367
-
368
-
369
-
370
-
371
-
372
-
373
-
374
 |
 |

226 FIAT GROUP
CONSOLIDATED
FINANCIAL
STATEMENTS
AT 31 DECEMBER
2009
NOTES
Sensitivity analysis
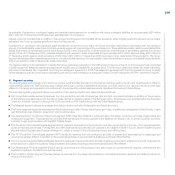
The potential loss in fair value of derivative financial instruments held by the Group at 31 December 2009 for managing exchange risk (currency swaps/
forward, currency options and interest rate and currency swaps), which would arise in the case of a hypothetical, unfavourable and instantaneous change of
10% in the exchange rates of the major foreign currencies with the Euro, amounts to approximately €544 million (€687 million at 31 December 2008). The
valuation model for currency options assumes that market volatility at year end remains unchanged.
Receivables, payables and future trade flows whose hedging transactions have been analysed were not considered in this analysis. It is reasonable to
assume that changes in exchange rates will produce the opposite effect, of an equal or greater amount, on the underlying transactions that have been
hedged.
The decrease over the previous year is due to a reduction in the hedged underlyings.
Interest rate risk
The manufacturing companies and treasuries of the Group make use of external funds obtained in the form of financing and invest in monetary and financial
market instruments. In addition, Group companies make sales of receivables resulting from their trading activities on a continuing basis. Changes in market
interest rates can affect the cost of the various forms of financing, including the sale of receivables, or the return on investments, and the employment of
funds, causing an impact on the level of net financial expenses incurred by the Group.
In addition, the financial services companies provide loans (mainly to customers and dealers), financing themselves using various forms of direct debt or
asset-backed financing (e.g. securitisation of receivables). Where the characteristics of the variability of the interest rate applied to loans granted differ from
those of the variability of the cost of the financing obtained, changes in the current level of interest rates can influence the operating profit/(loss) of those
companies and the Group as a whole.
In order to manage these risks, the Group uses interest rate derivative financial instruments, mainly interest rate swaps and forward rate agreements, with
the object of mitigating, under economically acceptable conditions, the potential variability of interest rates on net profit/(loss).
Sensitivity analysis
In assessing the potential impact of changes in interest rates, the Group separates out fixed rate financial instruments (for which the impact is assessed in
terms of fair value) from floating rate financial instruments (for which the impact is assessed in terms of cash flows).
The fixed rate financial instruments used by the Group consist principally of part of the portfolio of the financial services companies (basically customer
financing and financial leases) and part of debt (including subsidised loans and bonds).
The potential loss in fair value of fixed rate financial instruments (including the effect of interest rate derivative financial instruments) held at 31 December
2009, resulting from a hypothetical, unfavourable and instantaneous change of 10% in market interest rates, would have been approximately €70 million
(€47 million at 31 December 2008). The increased effect over 2008 is mainly due to the effect of new bond issues which increased the residual duration of
fixed rate liabilities.
Floating rate financial instruments include principally cash and cash equivalents, loans provided by the financial services companies to the sales network and
part of debt. The effect of the sale of receivables is also considered in the sensitivity analysis as well as the effect of hedging derivative instruments.
A hypothetical, unfavourable and instantaneous change of 10% in short-term interest rates at 31 December 2009, applied to floating rate financial assets
and liabilities, operations for the sale of receivables and derivatives financial instruments, would have caused increased net expenses before taxes, on an
annual basis, of approximately €11 million (€26 million at 31 December 2008). The decrease over 2008 reflects the reduced level of debt and the lower
level of interest rates used in the analysis.
This analysis is based on the assumption that there is a general and instantaneous change of 10% in interest rates across homogeneous categories. A
homogeneous category is defined on the basis of the currency in which the financial assets and liabilities are denominated.