Chrysler 2009 Annual Report Download - page 57
Download and view the complete annual report
Please find page 57 of the 2009 Chrysler annual report below. You can navigate through the pages in the report by either clicking on the pages listed below, or by using the keyword search tool below to find specific information within the annual report.-
 1
1 -
2
-
3
-
4
-
5
-
6
-
7
-
8
-
9
-
10
-
11
-
12
-
13
-
14
-
15
-
16
-
17
-
18
-
19
-
20
-
21
-
22
-
23
-
24
-
25
-
26
-
27
-
28
-
29
-
30
-
31
-
32
-
33
-
34
-
35
-
36
-
37
-
38
-
39
-
40
-
41
-
42
-
43
-
44
-
45
-
46
-
 47
47 -
 48
48 -
 49
49 -
 50
50 -
 51
51 -
 52
52 -
 53
53 -
 54
54 -
 55
55 -
 56
56 -
 57
57 -
 58
58 -
 59
59 -
 60
60 -
 61
61 -
 62
62 -
 63
63 -
 64
64 -
 65
65 -
 66
66 -
 67
67 -
68
-
69
-
70
-
71
-
72
-
73
-
74
-
75
-
76
-
77
-
78
-
79
-
80
-
81
-
82
-
83
-
84
-
85
-
86
-
87
-
88
-
89
-
90
-
91
-
92
-
93
-
94
-
95
-
96
-
97
-
98
-
99
-
100
-
101
-
102
-
103
-
104
-
105
-
106
-
107
-
108
-
109
-
110
-
111
-
112
-
113
-
114
-
115
-
116
-
117
-
118
-
119
-
120
-
121
-
122
-
123
-
124
-
125
-
126
-
127
-
128
-
129
-
130
-
131
-
132
-
133
-
134
-
135
-
136
-
137
-
138
-
139
-
140
-
141
-
142
-
143
-
144
-
145
-
146
-
147
-
148
-
149
-
150
-
151
-
152
-
153
-
154
-
155
-
156
-
157
-
158
-
159
-
160
-
161
-
162
-
163
-
164
-
165
-
166
-
167
-
168
-
169
-
170
-
171
-
172
-
173
-
174
-
175
-
176
-
177
-
178
-
179
-
180
-
181
-
182
-
183
-
184
-
185
-
186
-
187
-
188
-
189
-
190
-
191
-
192
-
193
-
194
-
195
-
196
-
197
-
198
-
199
-
200
-
201
-
202
-
203
-
204
-
205
-
206
-
207
-
208
-
209
-
210
-
211
-
212
-
213
-
214
-
215
-
216
-
217
-
218
-
219
-
220
-
221
-
222
-
223
-
224
-
225
-
226
-
227
-
228
-
229
-
230
-
231
-
232
-
233
-
234
-
235
-
236
-
237
-
238
-
239
-
240
-
241
-
242
-
243
-
244
-
245
-
246
-
247
-
248
-
249
-
250
-
251
-
252
-
253
-
254
-
255
-
256
-
257
-
258
-
259
-
260
-
261
-
262
-
263
-
264
-
265
-
266
-
267
-
268
-
269
-
270
-
271
-
272
-
273
-
274
-
275
-
276
-
277
-
278
-
279
-
280
-
281
-
282
-
283
-
284
-
285
-
286
-
287
-
288
-
289
-
290
-
291
-
292
-
293
-
294
-
295
-
296
-
297
-
298
-
299
-
300
-
301
-
302
-
303
-
304
-
305
-
306
-
307
-
308
-
309
-
310
-
311
-
312
-
313
-
314
-
315
-
316
-
317
-
318
-
319
-
320
-
321
-
322
-
323
-
324
-
325
-
326
-
327
-
328
-
329
-
330
-
331
-
332
-
333
-
334
-
335
-
336
-
337
-
338
-
339
-
340
-
341
-
342
-
343
-
344
-
345
-
346
-
347
-
348
-
349
-
350
-
351
-
352
-
353
-
354
-
355
-
356
-
357
-
358
-
359
-
360
-
361
-
362
-
363
-
364
-
365
-
366
-
367
-
368
-
369
-
370
-
371
-
372
-
373
-
374
 |
 |

REPORT ON
OPERATIONS
FINANCIAL
REVIEW -
FIAT GROUP
56
FINANCIAL REVIEW - FIAT GROUP
INTRODUCTION
Principal changes in the scope of consolidation in 2009
During the fourth quarter of 2009, Fiat Group Automobiles acquired activities formerly belonging to Gruppo Bertone.
Fiat Automobiles Serbia Doo Kragujevac was consolidated on a line-by-line basis from 1 January 2009. The company is 66.7% held by Fiat Group
Automobiles and 33.3% by the Republic of Serbia, pursuant to an agreement for the production of automobiles in Serbia.
On 30 January 2009, Magneti Marelli sold its stake in the subsidiary Ergom France S.a.S., which formed part of the Plastic Components &
Modules line.
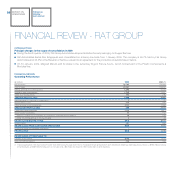
FINANCIAL REVIEW
Operating Performance
(€ million) 2009 2008 (*)
Net revenues 50,102 59,564
Cost of sales 43,261 49,612
Selling, general and administrative 4,296 5,075
Research and development 1,398 1,497
Other income/(expense) (89) (18)
TRADING PROFIT/(LOSS) 1,058 3,362
Gains/(losses) on disposal of investments 4 20
Restructuring costs 312 165
Other unusual income/(expense) (391) (245)
OPERATING PROFIT/(LOSS) 359 2,972
Financial income/(expense) (753) (947)
Result from investments: 27 162
Share of profit/(loss) of investees accounted for using the equity method 18 133
Other income/(expense) from investments 9 29
PROFIT/(LOSS) BEFORE TAXES (367) 2,187
Income taxes 481 466
PROFIT/(LOSS) FROM CONTINUING OPERATIONS (848) 1,721
Profit/(loss) from discontinued operations - -
PROFIT/(LOSS) (848) 1,721
PROFIT/(LOSS) ATTRIBUTABLE TO:
Owners of the parent (838) 1,612
Non-controlling interests (10) 109
(*) Following adoption of the improvement to IAS 16 in 2009, amounts published in the Consolidated Financial Statements at 31 December 2008 have been adjusted as follows: a €184 million increase
in net revenues, a €189 million increase in cost of sales and a €5 million decrease in other income (net of other expense).